SPRUCE: Vegetation Phenology in Experimental Plots from Phenocam Imagery, 2015-2022
Description
This data set consists of PhenoCam data from the SPRUCE experiment from the beginning of whole ecosystem warming (Hanson et al. 2017) in August 2015 through March 31 of 2023, with start- and end-of-season phenological transition dates derived through the end of autumn 2022.
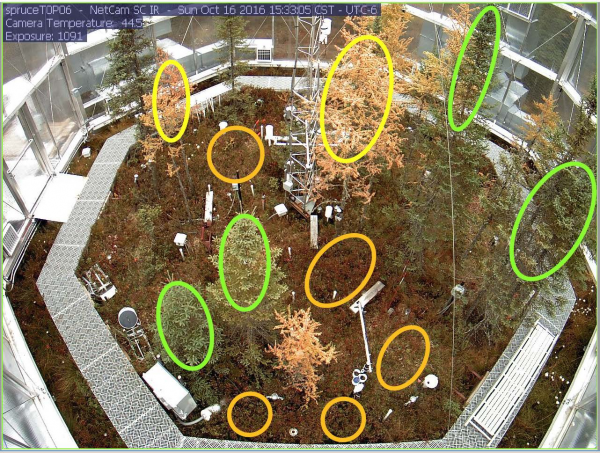
Digital cameras, or phenocams, installed in each SPRUCE enclosure track seasonal variation in vegetation “greenness”, a proxy for vegetation phenology and associated physiological activity. Three separate regions of interest (ROIs) were defined for each camera field of view, corresponding to different vegetation types and demarcating (1) Picea trees (vegetation type EN, for evergreen needleleaf); (2) Larix trees (vegetation type DN, for deciduous needleleaf); and (3) the mixed shrub layer (vegetation type SH).
This data set consists of three sets of data files:
- 3-day summary product files: One file for each camera and each ROI (i.e. vegetation type), characterizing vegetation color at a 3-day time step
- Contains 35 files in *.csv format inside a compressed (*.zip) file.
- Transition date file: Estimates “greenness rising” (spring) and “greenness falling” (autumn) transition dates derived from the smoothed daily green chromatic coordinate (GCC) values, for each camera and each ROI (i.e. vegetation type)
- Contains one file in *.csv format
- Snow flag files: Indicate days with snow on trees or snow on ground for each experimental enclosure
- Contains two files in *.csv format, one for snow on trees and one for snow on ground
This data set consists of two sets of companion files:
- Accompanying HTML files show the 90th quantiles of the mean GCC plotted together with transition dates for each vegetation type and plot.
- Contains three files in HTML format, one for each vegetation type
- One additional file in HTML format with the transition dates plotted for each vegetation type, by year
- R files for processing Phenocam files and flags.
- Contains five files in R file (*.R) format in one compressed (*.zip) file
User Note: All imagery is posted in near-real time to the PhenoCam Project web page (http://phenocam.sr.unh.edu/), where it is publicly available. Scroll to “spruce” in the Gallery or link directly to the 29 SPRUCE cameras at https://tinyurl.com/y7z5mau7.
The data reported here are based on the complete camera record from SPRUCE and supersedes the previously released phenocam datasets (see Related Data Sets). The estimated transition dates for previously released datasets may differ slightly (in most cases, by ±3 days or less), because following standard PhenoCam processing protocols (Richardson et al. 2018, Scientific Data), smoothing and interpolation, outlier removal, and transition date estimation are always conducted using the full data record.
Citation
Richardson, A.D., C. Schädel, J. Blais, T. Milliman, K. J. Pearson, M.B. Krassovski, and P.J. Hanson. 2021. SPRUCE Vegetation Phenology in Experimental Plots from Phenocam Imagery, 2015-2022. Oak Ridge National Laboratory, TES SFA, U.S. Department of Energy, Oak Ridge, Tennessee, U.S.A. https://doi.org/10.25581/spruce.108/1996813.
Download
Posted
Tuesday, August 29, 2023
SPRUCE ID: SPRUCE.108
Public
Click image to see full-sized version