


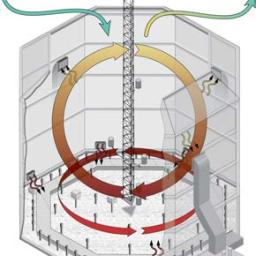
An experiment to assess the response of northern peatland ecosystems to increases in temperature and exposures to elevated atmospheric CO2 concentrations.
The SPRUCE experiment is the primary component of the Terrestrial Ecosystem Science Scientific Focus Area at ORNL focused on terrestrial ecosystems and the mechanisms that underlie their responses to environmental change. As of December 2025, the SPRUCE experiment is ending its planned decadal timeframe. Therefore, the website will be sunsetting in the near future. Data and Publications will continue to be accessible from the website and the SPRUCE ESS-DIVE Portal. Updates about the SPRUCE experiment will be on the TES SFA website.
A phased decommissioning of the experimental site begins in 2026 consistent with expectations of our research agreement between ORNL and the USDA Forest Service Marcell Experimental Forest. In 2026, post-treatment destructive sampling will conclude, and some automated data collection will continue. The team will work to complete data analyses, synthesis products, and model system enhancements; archival of data products at ESS-DIVE; and release of publications.
Recent Publications
-
Host species–microbiome interactions contribute to Sphagnum moss growth acclimation to warming.
-
Identification of shared viral sequences in peat moss metagenomes reveals elements of a possible Sphagnum core virome.
-
Interrelationships among methods of estimating microbial biomass across multiple soil orders and biomes.
Datasets
-
SPRUCE Whole Ecosystems Warming (WEW) Environmental Data Beginning August 2015
This dataset provides a record of the half-hourly averages of automated environmental data collected from the Spruce and Peatland Responses Under Changing Environments (SPRUCE…
-
SPRUCE Plot-Level Water Table Data Assessments for Absolute Elevations and Height with Respect to Mean Hollows Beginning in 2015
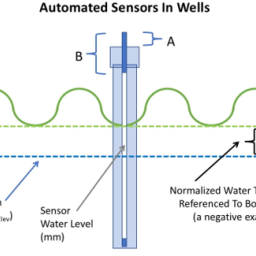
This data set provides a record of the half-hourly automated water table depth data collected for 12 SPRUCE plots (4, 6, 7, 8, 10, 11, 13, 14, 16, 17, 19, 20, and 21) beginning…
-
SPRUCE Whole Ecosystem Warming (WEW) Environmental Data and Water Table Summaries, Marcell Experimental Forest, Minnesota, 2015-2024
This data set contains observations of photosynthetically active radiation (PAR), precipitation, soil temperature, soil volumetric water content, air temperature, relative…
