The SPRUCE experiment was designed to explore ecological responses for trees, shrubs, bryophytes, microbial communities and whole-ecosystem processes across a broad range of above- and belowground temperatures increases, and understand how those responses to increased temperature will be altered by elevated atmospheric CO2 concentration.
Implemented Design
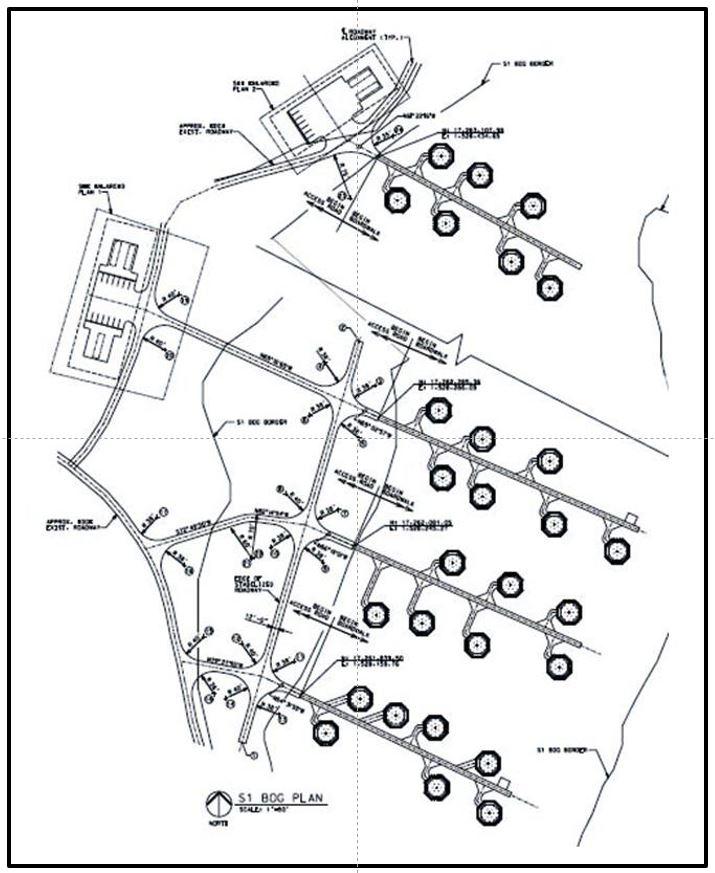
The treatment levels and their allocation to the available experimental units on the S1 bog were configured to provide optimal data for characterizing temperature response curves that might develop for plant or ecosystem level phenomenon. Temperature treatments range from ambient conditions to a +9°C differential from ambient, for both air and deep soil (Hanson et al. 2017). All warming treatment are repeated in combination with ambient or elevated CO2 atmospheres approaching 800 to 900 ppm.
Original Design Considerations
The original SPRUCE plan proposed an incomplete factorial using 28 experimental units that included four replicates of each of the following 7 treatments: Ambient plot, control plot at +0°, warmed plots at +3, +6, and +9°C and warmed plots exposed to elevated CO2 atmospheres at +3°C and +9°C. Although this approach was considered a viable option, project participants realized that the incomplete factorial design was statistically weak, open for criticism, and not the best approach for addressing our priority science questions surrounding responses to warming.
Regression-based Design Decision
Through quantitative analysis of different possible experimental designs, we concluded that a more flexible regression based experimental design including a broad range of temperature levels would provide us with more statistical power and better long-term data to characterize response curves for application within ecosystem and earth system models.
A regression-based experimental design appropriate for uncovering the shape of the temperature or other environmental response curves, was deployed as a better experimental design with more flexibility than traditional analysis of variance (ANOVA). Our approach allows us to evaluate and parameterize response curves for the shape of previously unmeasured phenomenon (Cottingham et al. 2005).
Quantitative analyses with simulated data sets with a realistic variance structure revealed that a regression approach with 10 temperature levels had greater statistical power to resolve temperature responses than the originally proposed 16 plots arranged as four levels of temperature in four blocks, and at substantially lower cost and infrastructure requirements. However, funding limitations did not allow this design to be fully constructed.
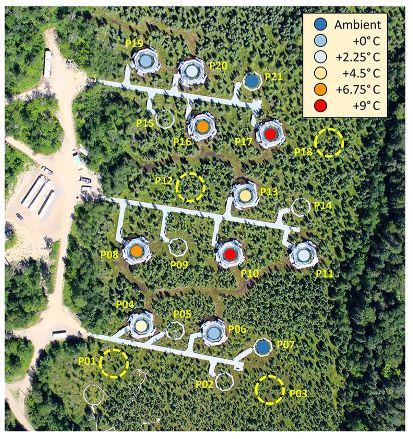
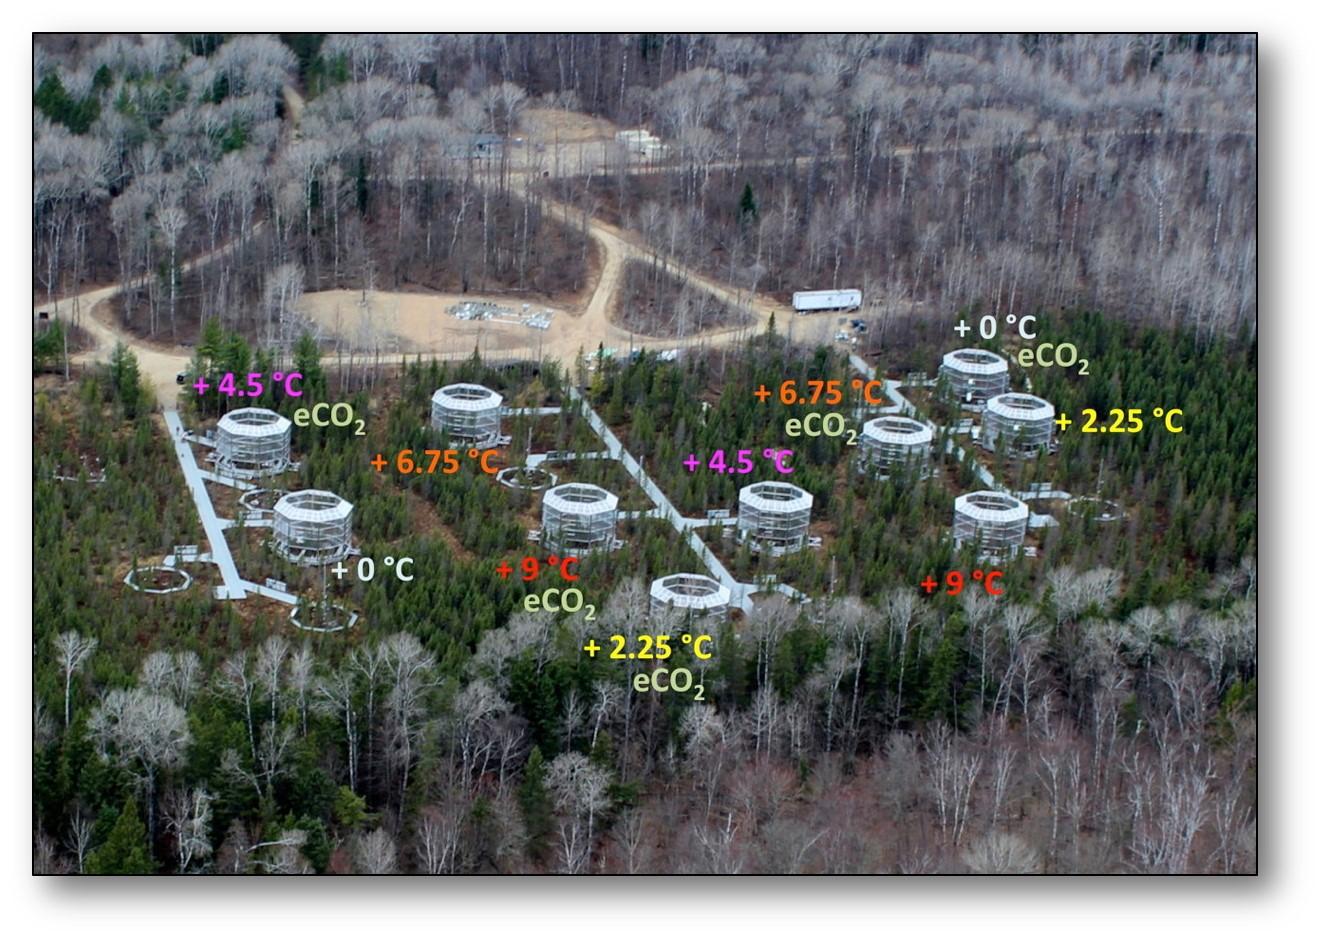
Instead, an experimental design with 5 warming levels was constructed and is operated in the S1 bog. Treatments are as follows:
Ambient [CO2] enclosures at +0, +2.25, +4.5, +6.75, and +9°C
Elevated [CO2] enclosures at +0, +2.25, +4.5, +6.75, and +9°C
We also instrumented and monitored chamberless control areas to assess the influence of the chamber infrastructure on the bog.
Practical Considerations
If necessary, the combination of treatment plots occupying 10 experimental units might be justifiably binned into low, medium and high temperature treatments for ANOVA based assessments for some variables.
In a regression based design the number of experimental units does, however, need to exceed the number of parameters included within a given regression equation to be evaluated.
Experimental units deployed over a broad range of temperatures provides us with some redundancy to protect against infrastructure failure while still allowing the flexibility to evaluate a range of forms for response curves. An important assumption is that there are no strong gradients across the experimental area that would mandate a block design. Preliminary survey data from the site justify making this assumption.
References
Cottingham KL, Lennon JT, Brown BL (2005) Knowing when to draw the line: designing more informative ecological experiments. Frontiers in Ecology and the Environment 3:145-152.
Hanson PJ, Riggs JS, Nettles WR, Phillips JR, Krassovski MB, Hook LA, Gu L, Richardson AD, Aubrecht DM, Ricciuto DM, Warren JM, Barbier C (2017) Attaining whole-ecosystem warming using air and deep soil heating methods with an elevated CO2 atmosphere. Biogeosciences 14: 861–883, doi: 10.5194/bg-14-861-2017