SPRUCE Vegetation Phenology in Experimental Plots from Phenocam Imagery, 2015-2017
Description
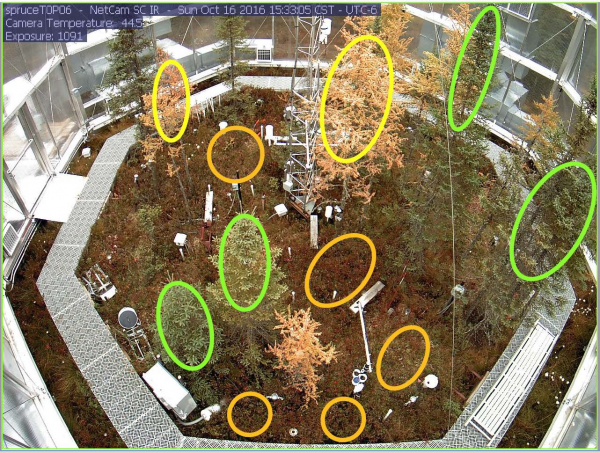
This data set consists of PhenoCam data from the SPRUCE experiment from the beginning of whole ecosystem warming in August 2015 through the end of 2017. Digital cameras, or phenocams, installed in each SPRUCE enclosure track seasonal variation in vegetation “greenness”, a proxy for vegetation phenology and associated physiological activity. Regions of interest (ROIs) were defined for vegetation types (1) Picea trees (EN, evergreen needleleaf); (2) Larix trees (DN, deciduous needleleaf); and (3) the mixed shrub layer (SH, shrubs).
User note: This dataset has been superseded by a later version. For most recent version, please see:
Richardson, A.D., C. Schädel, J. Blais, T. Milliman, K. J. Pearson, M.B. Krassovski, and P.J. Hanson. 2021. SPRUCE Vegetation Phenology in Experimental Plots from Phenocam Imagery, 2015-2022. Oak Ridge National Laboratory, TES SFA, U.S. Department of Energy, Oak Ridge, Tennessee, U.S.A. https://doi.org/10.25581/spruce.108/1996813.
Citation
Richardson, A.D., K. Hufkens, T. Milliman, D.M. Aubrecht, M.E. Furze, B. Seyednasrollah, M.B. Krassovski, and P.J. Hanson. 2018. SPRUCE Vegetation Phenology in Experimental Plots from Phenocam Imagery, 2015-2017. Oak Ridge National Laboratory, TES SFA, U.S. Department of Energy, Oak Ridge, Tennessee, U.S.A. https://doi.org/10.3334/CDIAC/spruce.045
Download
Posted
Wednesday, May 30, 2018
SPRUCE ID: spruce.045
Public
Click image to see full-sized version