Public Datasets
The data collected and the techniques used by SPRUCE scientists should conform to or reference national and international standards and protocols if they exist and when they are relevant and appropriate.
-

SPRUCE Whole Ecosystems Warming (WEW) Environmental Data Beginning August 2015
This data set provides a record of the half-hourly averages of automated environmental data collected for 12 SPRUCE plots (4, 6, 7, 8, 10, 11, 13, 16, 17, 19, 20, and 21) beginning during deep peat heating (DPH) and continuing throughout the whole ecosystem warming (WEW) manipulations for the SPRUCE Project (Hanson et al. 2017). In August 2015, WEW was initiated at 5 warming levels (+0, +2.25 +4.5, +6.75 and +9 °C) with 2 plots per warming level. DPH measurements were underway before the initiation of WEW heating treatments and both are expected to operate through 2025. This current version includes data from 2014 through 2024.
This data set includes 15 data files provided in comma separated (*.csv) format: 12 individual data files for each of the monitored SPRUCE plots, two data files corresponding to figures from Hanson et al. (2017) that support key analyses of the performance of the WEW systems, and one data file containing snow and ice depths.
These data provide environmental measurements collected during the implementation of operational methods to achieve both deep soil heating (0-3 m) and whole-ecosystem warming (WEW) appropriate to the scale of tall-stature, high-carbon, boreal forest peatlands. The methods were developed to allow scientists to provide a plausible set of ecosystem warming scenarios within which immediate and longer term (one decade) responses of organisms (microbes to trees) and ecosystem functions (carbon, water and nutrient cycles) could be measured. Elevated CO2 was also incorporated to test how temperature responses may be modified by atmospheric CO2 effects on carbon cycle processes.
-
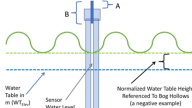
SPRUCE Plot-Level Water Table Data Assessments for Absolute Elevations and Height with Respect to Mean Hollows Beginning in 2015
This data set provides a record of the half-hourly automated water table depth data collected for 12 SPRUCE plots (4, 6, 7, 8, 10, 11, 13, 14, 16, 17, 19, 20, and 21) beginning during deep peat heating (DPH) in 2015 and continuing throughout the whole ecosystem warming (WEW) manipulations for the SPRUCE Project (Hanson et al. 2017). The data currently cover 2015-05-12 through 2024-12-31 and will be updated periodically throughout the duration of the SPRUCE project.
Also provided are daily plot normalized data for water table depths with respect to mean hollow locations within each plot. The hollow referenced data provide the basis for the intercomparison of peat saturation or aeration across treatment plots.
A limited data set for manual water table observations made periodically from 2015-2022 are also provided as a reference to the plot center automated observations.
In August 2015, WEW was initiated at 5 warming levels (+0, +2. +4.5, +6.75 and +9 °C) with 2 plots per warming level. DPH measurements were underway before the initiation of WEW heating treatments and both are expected to operate through 2025. Elevated CO2 treatments were added in June 2016 (Enclosures 4, 10, 11, 16 and 19). All measurements were made at the 8.1-ha S1 bog forest site in northern Minnesota, 40 km north of Grand Rapids, in the USDA Forest Service Marcell Experimental Forest (MEF).
This dataset contains three data files in comma separated (*.csv) format.
-
SPRUCE Whole Ecosystem Warming (WEW) Environmental Data and Water Table Summaries, Marcell Experimental Forest, Minnesota, 2015-2024
This data set contains observations of photosynthetically active radiation (PAR), precipitation, soil temperature, soil volumetric water content, air temperature, relative humidity, and normalized water table depth that are summarized on a daily, weekly, monthly, and annual basis for each of the SPRUCE plots. Observations span 2015-2024. This dataset draws on several datasets (Hanson et al. 2016; Hanson et al. 2020; and Warren, unpublished data) and compiles these environmental observations into useful formats for data analysis. These environmental metrics can be used to understand the environmental conditions inside SPRUCE environmental chambers throughout the durations of the experiment and can be paired with other data for modeling and analysis. R code used to generate these files is provided as part of the data package. This dataset contains four data files in comma separate (.csv) format and a compressed folder (*.zip) containing three R (*.r) scripts. Additional metadata are provided: one data dictionary and a file-level metadata file in comma separate (.csv) format and a user guide in PDF (*.pdf) format.
User note: Users must cite the original dataset/s along with this dataset when publishing any analyses using this dataset. Details on the dataset used to compile each variable are available in the header row of the files and in the user guide.
-
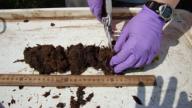
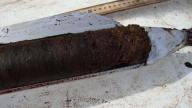
SPRUCE Peat Core Sample Collection Metadata, Marcell Experimental Forest, Minnesota, August 2025
This data set contains metadata associated with peat core samples collected from the Spruce and Peatland Responses Under Changing Environments (SPRUCE) experiment in August 2025. This sample metadata contains no analytical results and is a reference for analytical datasets. To ensure accessibility and discoverability, each sample was assigned an International Generic Sample Number (IGSN), a persistent identifier, using System for Earth and Extraterrestrial Sample Registration (SESAR). These samples were used for downstream analysis by multiple teams of researchers the results of which will be reported separately. This dataset contains one data file in comma separate (.csv) format. Additional metadata are provided: one data dictionary and a file-level metadata file in comma separate (.csv) format and a user guide in PDF (*.pdf) format.
An aliquot of most samples is stored in the SPRUCE archive and may be available for further analysis by request. Access this collection event on SESAR https://doi.org/10.58052/IEJ9B05LW. To inquire about obtaining archived samples for analysis, reach out using the Contact Sample Owner form located on the bottom of the landing page in SESAR.
-
SPRUCE Wood Anatomy of Picea mariana and Larix laricina in SPRUCE Experimental Plots, Marcell Experimental Forest, Minnesota, July 2023
Branch samples were collected in July 2023 to measure wood anatomical traits on two dominant conifer species, Picea mariana and Larix laricina, in a bog forest at the SPRUCE (Spruce and Peatland Responses Under Changing Environments) experiment in northern Minnesota. Anatomical measurements were made on the annual rings of those branches with dates ranging from 2011-2023. Wood anatomical measurements include annual tracheid diameter, tracheid density, cell wall thickness, thickness-to-span-ratio, and conduit lumen fraction in both earlywood and latewood. Wood anatomical samples were prepared using a portable sliding microtome (G.S.L.-1 lightweight microtome, WSL) and a light microscope (Leica DM2500). This dataset spans 2011–2023, with full branch-level coverage for 2020–2023, whereas some thinner branches formed only in recent years and therefore do not contain rings from earlier years. By providing annual, treatment-specific anatomical measurements, this dataset can help quantify structural acclimation to global change, clarify links among phenology, wood formation, and hydraulic traits, and improve predictions of forest growth response under future climates.
This dataset contains one data file in comma separate (.csv) format. Additional metadata are provided: one data dictionary and a file-level metadata file in comma separate (.csv) format and a user guide in PDF (*.pdf) format.
-
SPRUCE Peat Core Sample Collection Metadata, Marcell Experimental Forest, Minnesota, August 2024
This data set contains metadata associated with peat core samples collected from the Spruce and Peatland Responses Under Changing Environments (SPRUCE) experiment in August 2024. This sample metadata contains no analytical results and is a reference for analytical datasets. To ensure accessibility and discoverability, each sample was assigned an International Generic Sample Number (IGSN), a persistent identifier, using System for Earth and Extraterrestrial Sample Registration (SESAR). These samples were used for downstream analysis by multiple teams of researchers, the results of which will be reported separately. This dataset contains one data file in comma separate (.csv) format. Additional metadata are provided: one data dictionary and a file-level metadata file in comma separate (.csv) format and a user guide in PDF (*.pdf) format.
An aliquot of most samples is stored in the SPRUCE archive and may be available for further analysis by request.
-
SPRUCE Aboveground Vegetation Coverage in Root Ingrowth Core Plots, Marcell Experimental Forest, Minnesota, August 2022
This dataset contains vegetation survey measurements from root ingrowth core plots (Määttä et al. 2025) inside SPRUCE Experiment plots at the Marcell Experimental Forest in northern Minnesota. Vegetation surveys were conducted in 0.25 meter2 plots containing root ingrowth cores on August 8th and 9th, 2022 (2022-08-08 to 2022-08-09). The warming and elevated carbon dioxide (CO2) treatments in the dataset include the full treatment gradient: +0 degrees Celsius (C) (+0 and +500 parts per million (ppm) elevated CO2), +2.25 degrees C (+0 and +500 ppm), +4.5 degrees C (+0 and +500 ppm elevated CO2), +6.75 degrees C (+0 and +500 ppm) and +9 degrees C (+0 and +500 ppm elevated CO2) for both hummocks and hollows. This dataset includes measurements of the height and absolute coverage (%) for each vascular plant and moss species, as well as organic litter and dead overstory vascular plants, and the distance from the grid center to the nearest tree and the species of the nearest tree. These data were used as species-specific aboveground plant metadata for assessing the warming and elevated CO2 response of fine roots across different peatland microtopographical features (hummocks and hollows) and plant functional types (shrub, spruce and larch).
This dataset contains one data file in comma separate (.csv) format. Additional metadata are provided: one data dictionary and a file-level metadata file in comma separate (.csv) format and a user guide in PDF (*.pdf) format.
-
SPRUCE Measurements of Fine Root Production and Chemistry from Root Ingrowth Cores, Marcell Experimental Forest, Minnesota, 2022-2023
This dataset contains fine root production and tissue chemistry measurements from root ingrowth cores. Ingrowth cores were deployed in peat from June 28, 2022 to June 24, 2023 (2022-06-28 to 2023-06-24) inside SPRUCE Experiment plots at the Marcell Experimental Forest in northern Minnesota. The warming and elevated carbon dioxide (CO2) treatments in this dataset include +0 degrees Celsius (C) (+0 and +500 parts per million (ppm) elevated CO2), +4.5 degrees C (+0 and +500 ppm elevated CO2) and +9 degrees C (+0 and +500 ppm elevated CO2) for both hummocks and hollows, as well as +2.25 degrees C (+0 and +500 ppm) and +6.75 degrees C (+0 and +500 ppm) for hollows from minimum 10 cm depth from the peat surface. Measurements include root average diameter, root length, root biomass, and root tissue nitrogen (%N and δ15N) and carbon (%C and δ13C) concentration per plant functional type and microtopographical feature. Root length and biomass are standardized to 10 cm depth. These data were used to assess the warming and elevated CO2 response of fine roots across different peatland microtopographical features (hummocks and hollows) and plant functional types (shrub, spruce and larch).
This dataset contains one data file in comma separate (.csv) format. Additional metadata are provided: one data dictionary and a file-level metadata file in comma separate (.csv) format and a user guide in PDF (*.pdf) format.
-
SPRUCE Methane Transport in Plants at S1 Bog, Marcell Experimental Forest, Minnesota, 2017-2019
This data set contains measurements of methane (CH4) transport by plants (both ground-layer and trees) and diffusion, as well as whole-plot emissions, taken in September 2018 and June 2019 in S1 Bog outside of the SPRUCE experimental enclosures. Additionally, CH4 and carbon dioxide (CO2) stable isotope data in porewater and atmospheric emissions were taken in July 2017 in the SPRUCE enclosures to explore the relative magnitude of CH4 oxidation. Episodic ebullition rates for S1 Bog are taken from Gill et al. (2017).
Methane transport is an important component of many ecosystem models of peatlands. The results were compared to two methane models that have been developed for the SPRUCE project, ELM-SPRUCE and TECO_SPRUCE.
This dataset contains six data files in comma separate (.csv) format. Additional metadata are provided: six data dictionaries and a file-level metadata file in comma separate (.csv) format and a user guide in PDF (*.pdf) format.
-
SPRUCE: Redox-Active Subsurface Organic Matter, Marcell Experimental Forest, Minnesota, 2023
This dataset contains measurements that report on the effects of the SPRUCE experimental treatments on redox-active organic matter (RAOM) reduction (Valenzuela and Cervantes, 2021). Measurements occurred at the SPRUCE Experiment site in the Marcell Experimental Forest in northern Minnesota, USA. This work is also a follow-up to Rush et al. (2021a) which investigated effects of temperature on RAOM reduction after two years of experimental warming (Rush et al. 2021b). This follow-up dataset addresses two main questions; (i) How does warming and elevated carbon dioxide (CO2) directly affect in situ RAOM reduction, and subsequent methane (CH4) and CO2 production, across the peat depth profile? and (ii) How has long-term warming and elevated CO2 changed the total RAOM pool, and subsequent CH4 and CO2 production, across the peat depth profile?
This dataset reports electron shuttling capacity (a proxy for RAOM reduction; Keller, and Takagi, 2013) and carbon dioxide (CO2) and methane (CH4) concentrations both in one-week in situ incubations (2023-05-31 to 2023-08-01) and 42-day laboratory incubations from peat collected in 2023 (2023-05-31 to 2023-06-26). Laboratory incubations also measured acetate concentrations. The 2023 laboratory incubations were also compared with laboratory incubations conducted on peat collected in 2016 (Rush et al. 2021b). This dataset contains three data files in comma-separate (.csv) format. Additional metadata are provided: three data dictionaries and a file-level metadata file in comma separate (.csv) format and a user guide in PDF (*.pdf) format.
-
SPRUCE: S1-Bog Phenology Movies, Beginning in 2010
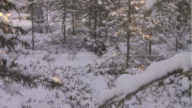
This dataset provides annual movies created from daily and twice daily images of (1) vegetation stands across the S1 Bog showing the seasonal changes of vegetation and appearance and disappearance of snow and (2) vegetation inside the SPRUCE experimental chambers and ambient unchambered plots showing the effects of experimental warming and elevated carbon dioxide (CO2) treatments both at the whole plot level and focus on a close-up on part of the shrub layer within each plot. SPRUCE is located in the S1 Bog, a Picea mariana [black spruce] – Sphagnum spp. bog forest in northern Minnesota, 40 km north of Grand Rapids, in the USDA Forest Service Marcell Experimental Forest (MEF). Movies are provided from June 2010 through December 2024 (2010-06-10 to 2024-12-31). The data set is expected to be appended with additional yearly input.
These movies cover both pre-treatment and current treatments of whole ecosystem warming and elevated carbon dioxide (CO2) treatments associated with the SPRUCE (Spruce and Peatland Responses Under Climatic and Environmental Change) experiment. There are ten experimental plots with chambers receiving five temperature treatments (+0, +2.25, +4.5, +6.75, +9°C) at ambient CO2, and the same five temperature treatments at elevated CO2 (+500 ppm). Movies for two unchambers ambient plots are included. Compiled movies are useful for examining the phenology of the bog, the changes to the landscape as experimental facilities were constructed, and the effects of warming and elevated CO2 within treatment plots.
Each of the provided files is a movie of compiled daily photos for the respective timeframe and camera view. This data set contains 230 video files in *.m4v, *.mp4, or *.mov format. -
SPRUCE: Chloroform Fumigation Extraction for Microbial Biomass and Dissolved Organic Carbon from SPRUCE, Marcell Experimental Forest, Minnesota, 2021, 2022, and 2024
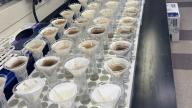
This data set provides the results for chloroform fumigation extraction (CFE) of peat samples collected from ambient and experimental plots in the Spruce and Peatland Responses Under Environmental Change (SPRUCE) Experiment site in June and August of 2021, June of 2022, and June, August, and October of 2024. The SPRUCE Experiment site is in the Marcell Experimental Forest in northern Minnesota, USA. The data set includes values for microbial biomass carbon (MBC), microbial biomass nitrogen (MBN), dissolved organic carbon (DOC), dissolved nitrogen (DN), moisture content (MC, available for 2021 and 2022 only) and gravimetric water content (GWC) at 11 depth increments of two-meter peat cores taken from 12 sampling sites at SPRUCE (10 temperature treatment enclosures, 2 ambient temperature treatment enclosures). The sample analysis followed standard methods. The samples were analyzed using a Shimadzu Total Organic Carbon/Nitrogen (TOC/N) analyzer (TOC-V and TOC-L; 2021-2022) or an Elementar vario TOC Cube (2024), liquid catalytic oxidation combustion analyzers for total carbon and nitrogen analysis. This dataset contains two data files in comma separate (.csv) format. Additional metadata are provided: two data dictionaries and a file-level metadata file in comma separate (.csv) format and a user guide in PDF (*.pdf) format.
-

SPRUCE Air 13C and 14C Isotopes, Marcell Experimental Forest, Minnesota, Beginning in 2016
This data set reports 13C and 14C signatures of air from the SPRUCE experimental study plots located in the S1-Bog from 2016-2025 (2016-04-13 to 2025-06-02). Future updates to this dataset will be made as these analyses are anticipated to continue through the end of the study in 2025. Air measurements were collected approximately five times throughout each active growing season beginning in 2016 and included the 10 SPRUCE experimental plots (Plots 4, 6, 8, 10, 11, 13, 16, 17, 19, and 20) two ambient co-located ambient plots (Plots 7 and 21) and a site at the Marcell Experiment Station’s S2-Bog meteorological station (MET) located 1.7 km northeast of the SPRUCE experimental site on the S1-Bog. Air samples were assessed for both 13C- and 14C-CO2 signatures. 13C and 14C isotopic signatures can be used in end-member analysis and C-cycle models to track the movement of C within the experimental ecosystem, calculate turnover times within plant tissues, and to test mechanisms used in models. This dataset contains one data file in comma separate (*.csv) format. Additional metadata are provided: one data dictionary and a file-level metadata file in comma separate (*.csv) format and a user guide in PDF (*.pdf) format.
-
SPRUCE Photosynthesis and Respiration of Picea mariana and Larix laricina in SPRUCE Experimental Plots, 2019
This data set contains physiological, morphological, and chemical measurements of the two dominant coniferous species, Picea mariana and Larix laricina, in August 2019 (2019-08-20 to 2019-08-22) at the SPRUCE (Spruce and Peatland Responses under Changing Environments) experiment site in the Marcell Experimental Forest in northern Minnesota, USA. These observations help to assess the effects of whole ecosystem scale warming and elevated CO2 concentrations on peatland ecosystems. Measurements include light-saturated photosynthesis and foliar dark respiration measurements under standard conditions and growth conditions involving varying temperatures and atmospheric CO2 concentrations, as well as leaf morphology measurements (leaf mass per unit leaf area) and nitrogen content based on mass and leaf area. Net photosynthesis and dark respiration measurements were taken using portable photosynthesis systems (LI6400XT, LI6800, LI-COR Biosciences, USA). This data set contains one data file in comma separate (*.csv) format. Additional metadata are provided: one data dictionary and a file-level metadata file in comma separate format and a user guide in PDF (*.pdf) format.
-
SPRUCE: Root Production Assessed with Manual Minirhizotrons Resolved to Plant Functional Type, 2015–2021
This data set contains raw root length and diameter for individual roots and estimated root population production measurements from the SPRUCE experiment from the beginning of whole ecosystem warming in 2015 through 2021 (2015-05-26 to 2021-09-01). Root morphology and estimated production were quantified throughout the peat profile with manual minirhizotrons deployed within SPRUCE plots. Images were processed using commercial software to quantify the length and diameter of individual roots. Roots were visually assigned to a plant functional type (PFT) of either (ericaceous) shrub, herb (sedges and Maianthemum trifolium), or tree (Larix laricina, Picea mariana) based on expert opinion. The biomass of individual roots was estimated using PFT-specific allometric equations (Iversen et al., 2018). Production per day was estimated as the length of new roots produced between imaging sessions, divided by the number of days between imaging sessions. These values were placed on a m2 aboveground area basis and scaled to a standard depth of 1m (roots are not evenly distributed with depth, do not interpret value as being on a m3 basis). Maximum and average (weighted by production length) depth of each PFT were also estimated within each minirhizotron tube. Annual production was interpolated as the average of four methods to scale these data (see Weber et al. submitted). Standing crop of roots was estimated for each tube as the maximum visible amount (both length and mass) of roots of that PFT for that year. These data expand the ability of researchers to accurately estimate the belowground dynamics of peatland vegetation, as well as the role that fine roots may play in impacting the fluxes of carbon within peatlands. This dataset contains three data files in comma separate (*.csv) format.
-
SPRUCE: Vegetation Phenology in Experimental Plots from PhenoCam Imagery, 2015-2024
This data set consists of PhenoCam data from the SPRUCE experiment from the beginning of whole ecosystem warming (Hanson et al. 2017) in August 2015 through March 31 of 2025 (2015-08-24 to 2025-03-31), with start- and end-of-season phenological transition dates derived through the end of autumn 2024.
Digital cameras, or phenocams, installed in each SPRUCE enclosure track seasonal variation in vegetation “greenness”, a proxy for vegetation phenology and associated physiological activity. Three separate regions of interest (ROIs) were defined for each camera field of view, corresponding to different vegetation types and demarcating (1) Picea trees (vegetation type EN, for evergreen needleleaf); (2) Larix trees (vegetation type DN, for deciduous needleleaf); and (3) the mixed shrub layer (vegetation type SH).
This data set consists of three sets of data files:
- 3-day summary product files: One file for each camera and each ROI (i.e. vegetation type), characterizing vegetation color at a 3-day time step
- Contains 36 files in *.csv format inside a compressed (*.zip) file.
- Transition date file: Estimates “greenness rising” (spring) and “greenness falling” (autumn) transition dates derived from the smoothed daily green chromatic coordinate (GCC) values, for each camera and each ROI (i.e. vegetation type)
- Contains one file in *.csv format
- Snow flag files: Indicate days with snow on trees or snow on ground for each experimental enclosure
- Contains two files in *.csv format, one for snow on trees and one for snow on ground
This data set consists of two sets of companion files:
- Accompanying HTML files show the 90th quantiles of the mean GCC plotted together with transition dates for each vegetation type and plot.
- Contains three files in HTML format, one for each vegetation type
- One additional file in HTML format with the transition dates plotted for each vegetation type, by year
- R files for processing Phenocam files and flags.
- Contains five files in R file(*.R) format and the components of the phenocamr package (Version 1.1.4) used for calculating transition dates for 2015-2024. These are contained in a compressed (*.zip) file
User Note: All imagery is posted in near-real time to the PhenoCam Project web page (https://phenocam.nau.edu), where it is publicly available. Scroll to “spruce” in the Gallery or link directly to the 29 SPRUCE cameras at https://tinyurl.com/sprucecams.
This data set is based on the complete camera record from SPRUCE and supersedes all previously released PhenoCam datasets (see Related Data Sets). The estimated transition dates for previously released datasets may differ slightly (in most cases, by ±3 days or less), because following standard PhenoCam processing protocols (Richardson et al. 2018, Scientific Data), smoothing and interpolation, outlier removal, and transition date estimation are always conducted using the full data record.
- 3-day summary product files: One file for each camera and each ROI (i.e. vegetation type), characterizing vegetation color at a 3-day time step
-

SPRUCE Ground Observations of Phenology in Experimental Plots, 2024
This data set consists of one comma separated (*.csv) file containing phenological transition dates, as derived from direct observations of vegetative and reproductive phenology recorded by a human observer, from the SPRUCE experiment during 2024 (2025-03-06 to 2025-11-21), the ninth full year of whole-ecosystem warming (Hanson et al. 2017). Both spring and autumn phenological events are included.
Since April 2016, human observers have been directly tracking the phenology of both woody and herbaceous species on a weekly schedule within the SPRUCE experimental chambers, these data are reported in annual ground observations data sets (see Related Data Sets). The observed date reported here is the first survey date in 2024 on which an event/phenophase was definitively observed.
This data set also contains a companion file in HTML (*.html) containing figures showing the relationship between the day of year and temperature treatment for different phenological phases by species for 2024.
User note: See user guide for a list additional datasets reporting on ground phenology from previous years.
-
SPRUCE Surface N2O fluxes measured with LI-7820, 2024
This data set contains N2O (nitrous oxide) efflux rates measured within SPRUCE experimental plots in 2024. N2O is a gaseous N species formed during the microbial processes of denitrification and ammonia oxidation, and is a powerful greenhouse. Measurements were made manually with a LiCor N2O/H2O analyzer (LI-7820) and paired SmartChamber (LI-8200-01S) in June, August, and October (2024-06-24 to 2024-10-22). During each measurement, the SmartChamber was placed on 8” PVC collars that were installed in May 2024. N2O flux was derived from 10-minute flux measurements processed using SoilFluxPro software (v5.3.1) and fit to a linear model. Model slope and R2 are reported along with soil water, soil temperature, and air temperature observations made with SmartChamber sensors. This dataset contains one data file in comma separate (*.csv) format.
-
SPRUCE: Manual Minirhizotron Images from Experimental Plots Beginning in 2013
Fine roots contribute to ecosystem carbon, water, and nutrient fluxes through resource acquisition, respiration, exudation, and turnover, but are understudied in peatlands. This data set consists of images of fine-root birth, growth, and death collected using non-destructive minirhizotron technology from a warming × CO2 enrichment experiment in a forested, ombrotrophic bog. Minirhizotron images were collected ~ weekly or bi-weekly beginning in 2013 in the 12 SPRUCE experimental plots in paired hummock and hollow microtopography. In each plot, one pair of minirhizotron tubes was installed within a 1.5 m radius of Picea mariana (spruce) or Larix laricina (larch) trees and one pair of minirhizotron tubes was installed in areas dominated by ericaceous shrubs Rhododendron groenlandicum and Chamaedaphne calyculata, for a total of 48 tubes.
This dataset contains minirhizotron images from 2013-06-02 through 2021-10-22. Image collections were finished at the end of 2021. Each imaging session (including the treed and non-treed locations, which were collected on different days due to time constraints) resulted in ~4500 image files in JPEG (.jpg) format. Images were collected from 396 sessions (including treed and non-treed sessions) with a total of 1,068,722 JPEG images.
-
SPRUCE Shrub-Layer Growth Assessments in S1-Bog Plots and SPRUCE Experimental Plots beginning in 2010
This data set reports shrub layer growth assessments for the S1-Bog on the Marcell Experimental Forest in Minnesota from 2010 through 2023 (2010-08-01 to 2023-08-31, no data were collected in 2020 and 2022). Data were obtained by destructively harvesting selected plots of varying number and size. In early years a distinct hummock and a hollow sampling square were both collected, but in later years unsampled hollow areas became unavailable due to prior sampling or instrument installations. Harvested samples were broken down species, tissue type (leaf or stem/), and by whether tissue was from the current year’s growth or growth from previous year’s growth. Dry mass of the leaf and stem fractions are provided. For 2011, 2012, 2017, 2018 and 2023, tissue carbon (C) and nitrogen (N) measurements are available for select samples. Future growth assessments are planned for 2025 and will be appended to this dataset. This dataset contains one data file in comma-separate (*.csv) format.
-
SPRUCE Bog Surface Elevation Assessments with SET Instrument Beginning in 2013
This data set reports plot-specific bog surface elevation measurements collected with the SPRUCE Elevation Transect (SET) instrument. The SET instrument is a modified version of the Cahoon et al. (2002) surface elevation table instrument. The device is mounted to fixed stands that are anchored in deep sediments, making it capable of identifying subtle changes in bog surface elevation.
Measurements are reported as absolute elevation in meters above mean sea level (amsl) for two locations in each of the SPRUCE experimental treatment plots and additional ambient boardwalk plots -- 4, 5, 6, 7, 8, 9, 10, 11, 13, 14, 15, 16, 17, 19, 20 and 21.
This data set reports measurements collected from June 2013 through August 2024 (2013-06-02 to 2024-08-14). It will be appended annually through 2025 as new data are collected. This data set contains one data file in comma separate (*.csv) format.
-
SPRUCE: Root Tip and Ectomycorrhizal Fungi Colonization Measurements from Ingrowth Cores, 2017
This data set contains root tip and ectomycorrhizal fungi colonization measurements taken from ingrowth cores from the SPRUCE experiment (Hanson et al. 2017) that were deployed during the 2017 growing season (2017-06 to 2017-10-01). This study explored the relationship between warming treatments and fine-root growth. Increased fine-root growth may increase root exudates and accelerate turnover, representing an underlying mechanism for peat decomposition through priming, as exudates provide a labile carbon source to the microbial community. Measurements include root tips counts and densities by tree species and the abundance of ectomycorrhizal colonization on root tips. This dataset contains one data file in comma separate (*.csv) format.
-
SPRUCE Atmospheric Gas and Aerosol Particle Concentrations, 2023-2024
This data set contains the concentration of atmospheric gases and aerosols at the SPRUCE site in the Marcell Experimental Forest in Minnesota during the summer of 2023 (2023-07-03 to 2023-08-22) and spring of 2024 (2024-04-04 to 2024-04-30). Measurements were performed in Plot 6 (control), Plot 17, (Ambient +9°C), Plot 19 (Ambient + 500 ppm CO2), and Plot 10 (Ambient +9°C and 500 ppm CO2). The main instrumentation used was the NanoScan Scanning Mobility Particle Sizer (SMPS) which measures the real-time and continuously the number concentration of minute sized particles with diameter between 10 to 420 nm. The NanoScan data set consists of 13 channels across the size distribution which provides a one-minute resolution.
During the 2024 campaign, a MODULAIR™ air quality monitor was deployed in Plots 6 and 17 to measure the concentration of particulate matter and four inorganic gases: Carbon monoxide (CO), nitrogen monoxide (NO), nitrogen dioxide (NO2), and ozone (O3). Meteorological parameters temperature and relative humidity were also included in this data, which were also collected using the MODULAIR. Additionally, a dedicated ozone monitor was deployed at the SPRUCE cabin in 2023 and in Plot 6 in 2024. This dataset contains twelve data files in comma separated (*.csv) format.
-
SPRUCE: Carbon Dioxide and Methane Soil Flux Measurements at High Temporal Resolution, Beginning in 2022
This data set contains high temporal resolution measurements of greenhouse gas flux (CO2 and CH4) from the SPRUCE (Spruce and Peatland Responses Under Changing Environments) experiment (Hanson et al. 2017) over the growing seasons in 2022 (30-minute resolution) and 2023 (15-minute resolution). Additional data will be appended to this dataset periodically until the close out of the SPRUCE experiment in 2025. This dataset contains two data files in comma-separate (*.csv) format.
ABB GLA131-GGA CO2/CH4 gas analyzers, each paired with an Eosense eosMX multiplexer and 2 eosAC-LT automated flux chambers, were deployed from during the 2022 and 2023 growing seasons (2022-06-06 – 2023-10-26). Each SPRUCE experimental enclosure included two Eosense 50 cm diameter flux chambers with 40 cm tall stainless steel collars embedded approximately 15 cm into the peat soil, to measure soil gas flux of peatland ecosystem moss-shrub communities. . Measurements were taken for three minutes, alternating between the flux chambers, with each Eosense flux chamber sampling gas fluxes four times per hour in 2023 and twice per hour for 2022. In addition, time-series environmental data measured at the flux chamber are included: Photosynthetically active radiation (PAR), soil temperature, soil volumetric water content (at 10 cm depth), air temperature, soil temperature (0-200 cm depth), and volumetric water at 20 cm depth.
-

SPRUCE: Vegetation Phenology in Experimental Plots from Phenocam Imagery, 2015-2023
This data set consists of PhenoCam data from the SPRUCE experiment from the beginning of whole ecosystem warming (Hanson et al. 2017) in August 2015 through March 31 of 2024, with start- and end-of-season phenological transition dates derived through the end of autumn 2023.
Digital cameras, or phenocams, installed in each SPRUCE enclosure track seasonal variation in vegetation “greenness”, a proxy for vegetation phenology and associated physiological activity. Three separate regions of interest (ROIs) were defined for each camera field of view, corresponding to different vegetation types and demarcating (1) Picea trees (vegetation type EN, for evergreen needleleaf); (2) Larix trees (vegetation type DN, for deciduous needleleaf); and (3) the mixed shrub layer (vegetation type SH).
This data set consists of three sets of data files:
- 3-day summary product files: One file for each camera and each ROI (i.e. vegetation type), characterizing vegetation color at a 3-day time step
- Contains 36 files in *.csv format inside a compressed (*.zip) file.
- Transition date file: Estimates “greenness rising” (spring) and “greenness falling” (autumn) transition dates derived from the smoothed daily green chromatic coordinate (GCC) values, for each camera and each ROI (i.e. vegetation type)
- Contains one file in *.csv format
- Snow flag files: Indicate days with snow on trees or snow on ground for each experimental enclosure
- Contains two files in *.csv format, one for snow on trees and one for snow on ground
This data set consists of two sets of companion files:
- Accompanying HTML files show the 90th quantiles of the mean GCC plotted together with transition dates for each vegetation type and plot.
- Contains three files in HTML format, one for each vegetation type
- One additional file in HTML format with the transition dates plotted for each vegetation type, by year
- R files for processing Phenocam files and flags.
- Contains five files in R file (*.R) format in one compressed (*.zip) file
User Note: All imagery is posted in near-real time to the PhenoCam Project web page (http://phenocam.sr.unh.edu/), where it is publicly available. Scroll to “spruce” in the Gallery or link directly to the 29 SPRUCE cameras at https://tinyurl.com/y7z5mau7.
The data reported here are based on the complete camera record from SPRUCE and supersedes the previously released phenocam datasets (see Related Data Sets). The estimated transition dates for previously released datasets may differ slightly (in most cases, by ±3 days or less), because following standard PhenoCam processing protocols (Richardson et al. 2018, Scientific Data), smoothing and interpolation, outlier removal, and transition date estimation are always conducted using the full data record.
- 3-day summary product files: One file for each camera and each ROI (i.e. vegetation type), characterizing vegetation color at a 3-day time step
-
SPRUCE: Ground Observations of Phenology in Experimental Plots, 2023
This data set consists of one comma separated (*.csv) file containing phenological transition dates, as derived from direct observations of vegetative and reproductive phenology recorded by a human observer, from the SPRUCE experiment during 2023 (2023-03-30 to 2023-11-29), the eighth full year of whole-ecosystem warming (Hanson et al. 2017). Both spring and autumn phenological events are included.
Since April 2016, human observers have been directly tracking the phenology of both woody and herbaceous species on a weekly schedule within the SPRUCE experimental chambers, these data are reported in annual ground observations data sets (see Related Data Sets). The observed date reported here is the first survey date in 2023 on which an event/phenophase was definitively observed.
This data set also contains a companion file in HTML (*.html) containing figures showing the relationship between the day of year and temperature treatment for different phenological phases by species for 2023.
User note: See user guide for a list additional datasets reporting on ground phenology from previous years.
-

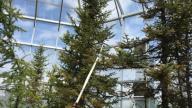
SPRUCE Terrestrial Laser Scanning of Experimental Plots Beginning in 2015
This data set comprises terrestrial laser scanning (TLS) point clouds from the SPRUCE experimental plots located in the S1-Bog of the Marcell Experimental Forest (MEF) near Grand Rapids, Minnesota. In 2015 and 2020, the 12 experimental SPRUCE plots were scanned near peak foliage ("summer”). In 2016-2019 and 2021-2023 the 12 plots were scanned prior to green up ("spring”) and once near peak foliage (Table 1). Additional data will be added through summer 2025.
A RIEGL VZ-1000 unit was used to collect all scans. Four TLS scans in each plot were registered to produce a single point cloud per plot using RiSCAN PRO v2.3 software. Up to six additional scans were registered to account for data occlusion when necessary. Point clouds are saved in LAS (*.las) 1.2 format. Point clouds were geo-registered to surveyed plot locations. There are 192 *.las files provided with this dataset.
-
SPRUCE Tree Growth Assessments of Picea and Larix in S1-Bog Plots and SPRUCE Experimental Plots, Beginning in 2011, Version 2
This data set reports tree growth measurements of mature Picea mariana and Larix laricina located in the S1-Bog permanent plots and the SPRUCE experimental study plots. Data have been collected annually from 2011 to 2024 (2011-02-23 to 2024-02-26) in late February/ early March to capture the productivity of the previous growing season (i.e. the February 2024 measurements track the 2023 growing season). Data collections are anticipated to continue through February of 2026 and this data set will be appended annually.
Initial observations in 2011 included measurements of circumference at 1.3 m (diameter at breast height assessments; DBH) above the nominal bog hollow surface, tree heights and crown diameters. Subsequent annual measurements have focused on the measures of circumference at DBH. Supplemental tree height data collected via terrestrial lidar (Graham et al. 2019) were initiated in 2016 and have been maintained annually. Circumference measurements to the nearest 0.1 cm are converted to DBH in cm and basal area at DBH in (cm2). Tree height and crown diameter are measured to the nearest 0.1 m. This dataset contains one data file in comma separate (*.csv) format.
User Note: In this Version 2, some previously released ‘Circum_Status’ values were updated to fix misread field measurements in previous years. The new data file, SPRUCE_Tree_Growth_Archive_20240620.csv, supersedes and replaces the previous, SPRUCE_Tree_Growth_Archive_20230327.csv.
-
SPRUCE Porewater Chemistry Data for Experimental Plots, Beginning in 2013, Version 4
This data set includes the chemistry of porewater in the SPRUCE experiment plots located in the S1 bog of the USDA Forest Service Marcell Experimental Forest (MEF) in northern Minnesota, 40 km north of Grand Rapids. Data are presented from June 2013 through September 2020 (2013-06-28 to 2020-09-28).
These data are the pre- and post-treatment data from the warming and elevated carbon dioxide (CO2) treatments associated with the SPRUCE experiment. There are 10 experimental plots in SPRUCE: 5 temperature treatments (+0, +2.25, +4.5, +6.75, +9°C) at ambient CO2, and the same 5 temperature treatments at elevated CO2 (+500 ppm). There are 7 additional ambient plots without experimental enclosures, and thus a total of 17 plots.
Water samples were analyzed for pH, specific conductivity, nutrient concentrations (ammonium, nitrate, soluble reactive phosphorus, total nitrogen, total phosphorus), cation concentrations (calcium, potassium, magnesium, sodium, aluminum, iron, manganese, silicon, strontium), anion concentrations (chloride, sulfate), and TOC concentrations. Subsets of the samples were analyzed for natural-abundance stable isotopes of water (δ18O-H2O and δD-H2O) and THg and MeHg concentrations.
User note: Results will be added to this data set and released to the public periodically as quality assurance and publication of results are accomplished. This June 2024 release (Version 4) is an updated and expanded version that supersedes and replaces the previous release. See the Data Release History table below for additional release notes.
-
SPRUCE: Phospholipid Fatty Acid (PLFA) Abundances, August 2021-June 2022
This data set provides the results for phospholipid fatty acid analysis (PLFA) of peat samples collected from ambient plots in the SPRUCE experiment site, with experimental plot samples still being processed. The samples used to generate this data set were collected on 2021-08-23 and 2022-06-21. This data set includes abundances for groups of lipids indicating total biomass, fungi, Gram-positive bacteria, Gram-negative bacteria, actinomycetes, and anaerobic bacteria. This data set contains one file in comma separate (*.csv) format.
Samples: On each sampling date, cores extending to 200 cm were collected and subsampled at 10 cm intervals from 0 and 100 cm and 25 cm intervals below 100 cm depth in Plot 7 and 21. During the lipid extraction procedure, samples were pooled into the following depth increments in order to obtain sufficient material to achieve adequate lipid yield: 0-10, 10-20, 20-30, 30-50, 50-100, and 100-150, and 150-200 cm.
-
SPRUCE: Quantitative PCR (qPCR) of microbial gene copy numbers, 2021-2022
This data set provides the results for quantitative polymerase chain reaction (qPCR) of peat samples collected from ambient and experimental plots in the Spruce and Peatland Responses Under Climatic and Environmental Change (SPRUCE) experiment site in June and August of 2021, and June of 2022. Additional dates and fungal gene copy data are in progress and will be added to the dataset when available. The data set includes bacterial and archaeal gene copy numbers, along with corresponding logarithmic values, at 11 depth increments of two-meter deep peat cores taken from 12 sampling sites locations inside SPRUCE plots(10 chambered and 2 ambient plots). The sampling, sample prep and analysis followed standard methods outlined in prior publications (Wilson et al. 2016; Kluber et al. 2020) except that a higher yielding Omega Bio-Tek Mag-Bind Environmental DNA 96 Kit was used for extractions and DNA was quantified using Qubit dsDNA High Sensitivity Assay Kit. This data set contains one file in comma separate (*.csv) format.
-
SPRUCE 13C-Phospholipid Fatty Acid (13C-PLFA) Abundances, June 2014-June 2015
This data set provides the results of 13C phospholipid fatty acid analysis (13C-PLFA) of peat samples collected from ambient and experimental plots in the SPRUCE experiment site. The samples used to generate this data set were collected just prior to initiation of deep peat heating (DPH; 03 June 2014), after 3 months (09 September 2014), and after 10 months (16 June 2015). This data set includes the abundances and delta-13C isotopic signatures of individual lipids and of groups of lipids indicating total biomass, fungi, Gram-positive bacteria, Gram-negative bacteria, actinomycetes, and anaerobic bacteria. This dataset contains two files in comma separate (*.csv) format.
Cores extending to 250 cm (200 cm in June 2015) were collected and subsampled at 10 cm intervals from 0 and 100 cm and 25 cm intervals below 100 cm depth. During the lipid extraction procedure, samples were pooled into the following depth increments in order to obtain sufficient material to achieve adequate lipid yield: 0-20, 20-50, 50-100, 100-150, 150-200, and 200-250cm.
-
SPRUCE: Anaerobic oxidation of methane mitigates net methane production and responds to long-term experimental warming in a northern bog: Supporting data
This data set contains measurements of anaerobic oxidation of CH4 (AOM), net CH4 production, CO2 production, and gross CH4 production measurements from the SPRUCE experiment (Hanson et al. 2017). Two experiments were conducted on different dates.
In experiment 1, net CH4 and CO2 production were measured with a gas chromatograph through the peat profile at in situ temperatures of the SPRUCE plots four times from May to October, 2016 (2016-05 to 2016-10). Two treatments were examined, a Porewater Treatment that was a 1:1 volumetric peat:porewater slurry and a No Porewater Treatment that was field-moist peat with no porewater added. Additionally, net CH4 production were measured at frequent intervals (from 4 hr to 9 d) in peat from selected SPRUCE plots from soil collected on October 16, 2016 (2016-10-16). Samples were collected from the SPRUCE plots, immediately made anaerobic, and transported to the University of Oregon for rate measurements within several days of collection.
In experiment 2, AOM, net CH4 production, CO2 production, and gross CH4 production were measured through the peat profile at in situ field temperatures once from samples collected in July, 2021 (2021-07). The same two porewater treatments were examined. AOM was measured with a 13CH4 tracer method using a Picarro G2201-i analyzer for isotopic CO2/CH4 quantification with a small stable isotope module attached.
This data set contains three data files in comma separate (*.csv) format.
User note: This dataset is associated with the following publication:
Barney, M., A. M. Hopple, L. L. Gregory, J. K. Keller, and S. D. Bridgham. Anaerobic oxidation of methane mitigates net methane production and responds to long-term experimental warming in a northern bog. Manuscript submitted for review. 2023. -
SPRUCE: Climate Warming and Elevated CO2 Rapidly Alter Peatland Soil Carbon Sources and Stability: Supporting Data
The data set reports a suite of complementary biogeochemical analyses of peat samples from the SPRUCE (Spruce and Peatland Responses Under Changing Environments) experiment. Results were collected using quantitative molecular analysis of bulk soil carbon to assess the stability of soil organic carbon following whole-ecosystem warming and exposure to elevated carbon dioxide concentrations (eCO2). Targeted soil organic carbon components include solvent-extractable compounds (alkanoic acids, alkanols, alkanes, steroids, and terpenoids), ester-bound hydrolysable biopolymers (cutin and suberin markers), lignin phenols, and pyrogenic carbon. Bulk peat samples were analysed by Soxhlet extraction and solid phase separation for solvent-extractable compounds, alkaline hydrolysis to extract hydrolysable biopolymers, copper (II) oxide oxidation to extract lignin phenols and benzene polycarboxylic acids (BPCAs) as an approximation of pyrogenic carbon. Samples were analysed by gas chromatography (GC) equipped with a flame ionization detector (GC-FID) and compound identification was performed on GC coupled to mass selective detector (MS) for solvent-extractable compounds, ester-bound hydrolysable biopolymers and lignin phenols, and high-performance liquid chromatograph (HPLC) for pyrogenic carbon. Results are presented in Ofiti et al. (accepted).
The experimental work was conducted on samples collected in August 2018 at the SPRUCE climate manipulation experiment in northern Minnesota, 40 km north of Grand Rapids, in the USDA Forest Service Marcell Experimental Forest (MEF). Samples were collected and later analysed in a 10 cm increments over 0 to 50 cm depth and 25 cm intervals from 50 to 75 cm. Samples were analyzed for lignin phenols over 0 to 30 cm depth. This data set contains one file in comma separate (*.csv) format.
-
SPRUCE Diurnal and Seasonal Patterns of Water Potential in S1 Bog and SPRUCE Experimental Plot Vegetation beginning in 2010
This data set reports on water potential from excised terminal shoots or leaves (Mainthemum only) of vegetation at the SPRUCE site located in the S1 bog. Pretreatment measurements were collected from outside plots within the S1 bog. Post treatments were collected from inside SPRUCE plots. Water potential was measured on the overstory canopy species, consisting of the evergreen Picea mariana (Mill.) B.S.P. (black spruce) and deciduous Larix laricina (Du Roi) K. Koch (tamarack) trees, and ericaceous shrubs < 1 m tall, consisting of the evergreen Rhododendron groenlandicum (Oeder) Kron & Judd (Labrador tea) and Chamaedaphne calyculata (L.) Moench. (leatherleaf). Some measurement campaigns also included the evergreen Kalmia polifolia, Wangenh. (bog laurel), the deciduous Vaccinium angustifolium (Aiton) (blueberry), and the herbaceous Maianthemum trifolium (L.) Sloboda (three-leaf false Solomon’s seal).
This dataset contains one data file in comma-separated (*.csv) format. This is the second release of water potential data from the site with additional data from 2018 and 2019. These data cover 2010-06-22 to 2019-07-16. Further results will be added to this data set and released to the public periodically as quality assurance and publication of results are accomplished.
There are 10 experimental plots in SPRUCE: five temperature treatments (+0, +2.25, +4.5, +6.75, +9°C) at ambient CO2, and the same five temperature treatments at elevated CO2 (+500 ppm). These data span the pre- and post-treatment periods when enclosed plots were exposed to warming and elevated carbon dioxide (CO2) within the SPRUCE experiment. The pretreatment samples were collected from south end of the S1 bog prior to SPRUCE boardwalk construction, then throughout the bog once the boardwalks were completed.
-
SPRUCE Manual Phenology Observations and Photographs Beginning in 2011
This dataset contains periodic (most often weekly during the active season) observations of the phenology of vegetation bud swell, leaf out, leaf off, flowering, fruiting and the nature of snow cover and ice presence from the 2011-2023 growing seasons. These observations are supplemented by the collection of images from periodic photographs of the experimental plots (e.g., panoramic photographs) or images within plots (e.g., pictures of vegetation development or community status within defined ground footprints such as flux collars). A summary of vegetation phenology and snow and ice presence form 2011-2016 is also provided. Related data sets are also available that summarize site phenology (see Related Datasets). This dataset contains 336 phenology notes files in *.pdf format, 2284 phenology photos in *.jpg format, and three companion files containing phenology summaries, methodological, other contextual information. Early observations were conducted throughout the S1-Bog with an emphasis on the southern end of the bog. Observations collected since the spring of 2013 have focused on the southern end of the S1-Bog and the plots 2 through 21 of the SPRUCE experiment. Beginning in 2015 those observations included assessments within the enclosure space surrounding plots 4, 6, 8, 10, 11, 13, 16, 17, 19 and 20. These observations are ongoing, and this dataset will be appended annually. -
SPRUCE Sphagnum Growth and Photosynthesis Responses to Shading Treatments, 2021
This data set reports growth, water content, nitrogen concentration, and photosynthesis of Sphagnum grown under shade cloth of different density in replicated plots adjacent to the SPRUCE experimental study plots located in the S1-Bog. Data are reported for May to October 2021. This dataset contains three files in comma-separate (*.csv) format. Investigations were instigated from questions arising in the SPRUCE experiment where the Sphagnum-shrub-spruce/larch ecosystem is exposed to air and peat warming in combination with elevated atmospheric CO2. SPRUCE is located at the 8.1-ha S1 Bog forest site in northern Minnesota, 40 km north of Grand Rapids, in the USDA Forest Service Marcell Experimental Forest (MEF).
Thirty plots (35 × 35 cm) were established in May, 2021, in three blocks on unused large plots on the S-1 bog. Data are reported for growth of Sphagnum angustifolium/fallax and S. divinum growing in plastic columns within the shade plots. Growth is reported as dry mass of new tissue measured when the columns were harvested in October 2021. Additional measurements in the final harvest data set include Sphagnum water content, new stem length, mass per unit length, and nitrogen content. Stem extension was measured periodically during the summer and reported in a separate data set as stem length. Photosynthesis of Sphagnum angustifolium/fallax samples from hollows under low and high shade was measured in the laboratory.
-
SPRUCE: Vegetation Phenology in Experimental Plots from Phenocam Imagery, 2015-2022
This data set consists of PhenoCam data from the SPRUCE experiment from the beginning of whole ecosystem warming (Hanson et al. 2017) in August 2015 through March 31 of 2023, with start- and end-of-season phenological transition dates derived through the end of autumn 2022.
Digital cameras, or phenocams, installed in each SPRUCE enclosure track seasonal variation in vegetation “greenness”, a proxy for vegetation phenology and associated physiological activity. Three separate regions of interest (ROIs) were defined for each camera field of view, corresponding to different vegetation types and demarcating (1) Picea trees (vegetation type EN, for evergreen needleleaf); (2) Larix trees (vegetation type DN, for deciduous needleleaf); and (3) the mixed shrub layer (vegetation type SH).
This data set consists of three sets of data files:
- 3-day summary product files: One file for each camera and each ROI (i.e. vegetation type), characterizing vegetation color at a 3-day time step
- Contains 35 files in *.csv format inside a compressed (*.zip) file.
- Transition date file: Estimates “greenness rising” (spring) and “greenness falling” (autumn) transition dates derived from the smoothed daily green chromatic coordinate (GCC) values, for each camera and each ROI (i.e. vegetation type)
- Contains one file in *.csv format
- Snow flag files: Indicate days with snow on trees or snow on ground for each experimental enclosure
- Contains two files in *.csv format, one for snow on trees and one for snow on ground
This data set consists of two sets of companion files:
- Accompanying HTML files show the 90th quantiles of the mean GCC plotted together with transition dates for each vegetation type and plot.
- Contains three files in HTML format, one for each vegetation type
- One additional file in HTML format with the transition dates plotted for each vegetation type, by year
- R files for processing Phenocam files and flags.
- Contains five files in R file (*.R) format in one compressed (*.zip) file
User Note: All imagery is posted in near-real time to the PhenoCam Project web page (http://phenocam.sr.unh.edu/), where it is publicly available. Scroll to “spruce” in the Gallery or link directly to the 29 SPRUCE cameras at https://tinyurl.com/y7z5mau7.
The data reported here are based on the complete camera record from SPRUCE and supersedes the previously released phenocam datasets (see Related Data Sets). The estimated transition dates for previously released datasets may differ slightly (in most cases, by ±3 days or less), because following standard PhenoCam processing protocols (Richardson et al. 2018, Scientific Data), smoothing and interpolation, outlier removal, and transition date estimation are always conducted using the full data record.
-
SPRUCE Ground Observations of Phenology in Experimental Plots, 2022
This data set consists of one comma separated (*.csv) file containing phenological transition dates, as derived from direct observations of vegetative and reproductive phenology recorded by a human observer, from the SPRUCE experiment during 2022 (2022-03-28 to 2021-11-17), the seventh full year of whole-ecosystem warming (Hanson et al. 2017). Both spring and autumn phenological events are included.
Since April 2016, human observers have been directly tracking the phenology of both woody and herbaceous species on a weekly schedule within the SPRUCE experimental chambers, these data are reported in annual ground observations data sets (see Related Data Sets). The observed date reported here is the first survey date in 2022 on which an event/phenophase was definitively observed.
This data set also contains a companion file in HTML (*.html) containing figures showing the relationship between the day of year and temperature treatment for different phenological phases by species for 2022.
User note: See user guide for a list additional datasets reporting on ground phenology from previous years.
-
SPRUCE Peat Mercury, Methylmercury, and Sulfur Concentrations from Experimental Plot Cores, beginning in 2014
This data set reports the results of mercury, methylmercury, and sulfur measurements from peat core samples collected at SPRUCE experimental study plots located in the S1-Bog. Sample collection and analyses started in June of 2014 and will continue for the duration of the experiment. This current version includes data through 2019 (2014-06-03 to 2019-08-20). Data will be added to this data set and released to the public periodically as quality assurance and publication of results are accomplished. Data are presented in a single comma separated (*.csv) file.
Core samples are collected annually from all 12 plots to a depth of 200cm in 10cm and 25cm increments. Samples are analyzed for total mercury concentration, methylmercury concentration, percent carbon, percent nitrogen, and percent sulfur.
-
SPRUCE Peat Mercury, Methylmercury and Sulfur Concentrations from Experimental Plot Cores, 2012
This data set reports the results of analyses of peat core samples for total mercury and methylmercury, as well as carbon, nitrogen and sulfur. Samples were collected as part of a larger sampling campaign from the SPRUCE experimental study plots located in the S1-Bog.
From 2012-08-13 to 2012-10-15, a team of SPRUCE investigators and collaborators collected core samples of peat in the SPRUCE experimental plots. The goal was to characterize the biological, physical, and chemical characteristics of peat, and how those characteristics changed throughout the depth profile of the bog, prior to the initialization of the SPRUCE experimental warming and CO2 treatments.
Cores were collected from 16 experimental plots; peat cores were collected from the hummock and hollow surfaces to depths of 300 cm in 10 cm, 25, and 50 cm increments (Pierce et al, 2022). Three replicate cores were collected from both hummock and hollow locations in each plot. The coring locations within each plot were mapped.
This dataset contains one file in comma separated (*.csv) format.
User Note: The coring descriptions and some reported data are the same as in the related data set, Iverson et al. (2014). Samples for mercury and carbon, nitrogen and sulfur analyses by the University of Minnesota were collected as part of this sampling campaign.
-
SPRUCE Soil Metabolome Responses to Whole Ecosystem Warming in SPRUCE Experimental Plots, Beginning in 2016
This dataset reports a suite of complementary environmental geochemical analyses of peat extracts and porewater samples from SPRUCE experimental plots across a range of whole ecosystem warming (WEW) temperature treatments beginning in 2016. Results of peat extract analyses include NMR and GC-MS analyses of central metabolites, liquid chromatography mass spectra (LC-MS) analyses of lipids, and quantitative proteomics. Porewater was analyzed by FTICR-MS for secondary metabolites, and for carbon dioxide (CO2), methane (CH4) concentrations, stable isotope composition, and the differential solubility corrected CO2:CH4 ratio. This dataset contains six files in comma separated (*.csv) format.
-
SPRUCE: Mass and Chemistry of Peat Ladder Decomposition Treatments, 2017-2020
This data set reports on the mass and chemistry of peat inside decomposition ladders that were deployed at SPRUCE. Decomposition ladders were deployed on 2017-10-02 and collected on 2020-10-15 to observe peat decomposition and chemistry within four depth ranges (0-10cm, 10-20cm, 20-30cm, and 30-40cm). Data contain wet and oven-dried masses as well as percent nitrogen, percent carbon, and phosphorus concentration from the beginning of the deployment and after three years. These data are provided in two comma separated (*.csv) files. These treatments are ongoing and future data will be added to this dataset periodically.
-

SPRUCE: Sphagnum Phytobiome Responses to Whole Ecosystem Warming and Elevated Atmospheric CO2 in July, 2017-2021
This data set reports the (1) C and N isotopic composition of Sphagnum moss tissue collected from inside the SPRUCE experimental study plots from 2019-2021, as well as (2) rates of nitrogen fixation and methane oxidation measured for Sphagnum from 2017, 2019, and 2021. Both (1) and (2) also contain measurements of Sphagnum tissue % water content. This dataset contains two files in comma-separate (*.csv) format. Investigations leveraged the SPRUCE experiment where air and peat warming were combined in WEW treatments. SPRUCE is located at the 8.1-ha S1 Bog forest site in northern Minnesota, 40 km north of Grand Rapids, in the USDA Forest Service Marcell Experimental Forest (MEF).
- Sphagnum C and N concentrations and 13C and 15N isotopic natural abundance were determined for three replicate Sphagnum tissue samples collected from inside the SPRUCE enclosures in July 2019-2021. Elemental and isotope analyses were conducted at the University of Georgia – Center for Applied Isotope Studies (CAIS https://cais.uga.edu/). Plant elemental analysis was performed by the micro-Dumas method, while isotopic natural abundance was measured by isotope ratio mass spectrometry. 13C natural abundance is expressed as the per mille (‰) deviation from the Pee Dee Belemnite standard (PDB) 13C:12C ratio (δ13C), while 15N natural abundance is expressed as the ‰ deviation from the N2 atmospheric 15N:14N ratio (δ15N).
- Rates of nitrogen fixation and methane oxidation were measured using serum bottle incubations performed with Sphagnum collected inside the SPRUCE enclosures in July 2017, 2019, and 2021. Rates were calculated according to the amount of 15N-N2 or 13C-CH4 incorporated into the Sphagnum tissue or incubation headspace over the 48-hour incubation period. In 2017, incubations were performed in growth chambers set to the temperature of the experimental plots during Sphagnum sampling. In 2019 and 2021, the incubations were performed directly inside the experimental plots.
-

SPRUCE Deep Peat Heating (DPH) Peat Water Content and Temperature for Experimental Plot Cores, June 2014 through June 2015
This data set provides the peat water content and peat temperature at time of sampling for peat cores collected before and during the SPRUCE Deep Peat Heating (DPH) study. Cores were collected during three sampling events: 03 June 2014, 09 September 2014, and 16 June 2015.
Two cores were extracted from hollow locations in each of the 10 experimental plots (4, 6, 8, 10, 11, 13, 16, 17, 19, and 20). The five ambient plots (5, 7, 14, and 21) were not included in the DPH sampling efforts. See Table 1. Cores were partitioned into samples at 11 depth increments: 0-10, 10-20, 20-30, 30-40, 40-50, 50-75, 75-100, 100-125, 125-150, 150-175, and 175-200 cm below surface of the hollow.
The DPH study was undertaken to evaluate possible rapid responses of deep peat carbon (C) stocks, microbial communities, and biogeochemical cycling processes to unprecedented temperatures. In June 2014, deep soil heating was initiated at 5 warming levels (+0, +2.25, +4.5, +6.75 and +9 °C) with 2 replicate plots per level. Warming levels at depth were achieved over a 25 (+ 2.25 °C) to 60-day (+9 °C) period depending on the target treatment temperatures.
Data file: There is one comma-separated (*.csv) file with peat core water content and temperature at time of sampling, plus the amount of dried archived material retained after analyses.
User Note: In this third release, four variables related to extrapolations of peat core temperature were removed. See the Data Set History table for additional details.
-
SPRUCE Peat Physical and Chemical Characteristics from Experimental Plot Cores, Select Pre-Treatment 2012 and Post-Treatment 2020-21
This data set reports the results of physical and chemical analyses of peat core samples from the SPRUCE experimental study plots located in the S1-Bog after 5 full years of warming and elevated CO2 treatments in August 2020 and May 2021. Also included are select pre-treatment conditions data from the August 2012 dataset (Iversen et al. 2014) duplicated here for continuity and ease of access.
In 2020 and 2021, a team of SPRUCE investigators and collaborators collected core samples of peat in SPRUCE experimental plots. The goal was to characterize the biological, physical, and chemical characteristics of peat after 5-years of treatment applications to enable a discussion of how those characteristics changed throughout the depth profile of the bog in response to experimental warming and CO2 treatments.
Peat sampling and analytical methods were similar to those described for pretreatment samples (Iversen et al. 2014) with the exception that the original 0-10 cm depth increment for hollows was split into a 0-5 cm and a 5-10 cm depth increments to better characterize changes in the shallowest peat layer (0-5 cm representative of mostly live Sphagnum tissues) and the uppermost layer of decomposing peat (5-10 cm). The separation of the original surface layer into two distinct increments was done to allow more specific spatial and temporal evaluation of changing physical characteristics and the incorporation of new 13C and 14C isotopic signatures associated with the SPRUCE eCO2 treatments (Hanson et al. 2017).
A single high mineral content (i.e., non-peat) sample from Plot 8 collected below a depth of 175 cm was not included in this data set.
Post-treatment cores were collected from 10 experimental plots (Plots 4, 6, 8, 10, 11, 13, 16, 17,19 and 20) and two ambient plots (Plots 7 and 21). Samples were collected from hollow surfaces to depths of 200 cm in defined increments. The coring locations within each plot were mapped.
This data set contains one file in comma-separated (*.csv) format.
-
SPRUCE Vegetation Phenology in Experimental Plots from Phenocam Imagery, 2015-2021
This data set consists of PhenoCam data from the SPRUCE experiment from the beginning of whole ecosystem warming (Hanson et al. 2017) in August 2015 through March 31 of 2022, with start- and end-of-season phenological transition dates derived through the end of autumn 2021.
Digital cameras, or phenocams, installed in each SPRUCE enclosure track seasonal variation in vegetation “greenness”, a proxy for vegetation phenology and associated physiological activity. Three separate regions of interest (ROIs) were defined for each camera field of view, corresponding to different vegetation types and demarcating (1) Picea trees (vegetation type EN, for evergreen needleleaf); (2) Larix trees (vegetation type DN, for deciduous needleleaf); and (3) the mixed shrub layer (vegetation type SH).User note: This dataset has been superseded by a later version. For most recent version, please see:
Richardson, A.D., C. Schädel, J. Blais, T. Milliman, K. J. Pearson, M.B. Krassovski, and P.J. Hanson. 2021. SPRUCE Vegetation Phenology in Experimental Plots from Phenocam Imagery, 2015-2022. Oak Ridge National Laboratory, TES SFA, U.S. Department of Energy, Oak Ridge, Tennessee, U.S.A. https://doi.org/ 10.25581/spruce.108/1996813.
User Note: HTML files cannot be viewed in Dropbox, they must be downloaded and opened in a web browser.
-
SPRUCE Ground Observations of Phenology in Experimental Plots 2021
This data set consists of one comma separated (*.csv) file containing phenological transition dates, as derived from direct observations of vegetative and reproductive phenology recorded by a human observer, from the SPRUCE experiment during 2021, the sixth full year of whole-ecosystem warming (Hanson et al. 2017). Both spring and autumn phenological events are included.
Since April 2016, human observers have been directly tracking the phenology of both woody and herbaceous species on a weekly schedule within the SPRUCE experimental chambers, these data are reported in annual ground observations data sets (see Related Data Sets). The observed date reported here is the first survey date in 2021 on which an event/phenophase was definitively observed.
This data set also contains a companion file in HTML (*.html) format containing figures showing the relationship between the day of year and temperature treatment for different phenological phases by species for 2021.
User note: Phenological transition data from 2016-2021 are available. See the Related Datasets section of the user guide for more details.
-
SPRUCE Vegetation Phenology in Experimental Plots from Phenocam Imagery, 2015-2020
This data set consists of PhenoCam data from the SPRUCE experiment from the beginning of whole ecosystem warming (Hanson et al. 2017) in August 2015 through March 31 of 2021, with start- and end-of-season phenological transition dates derived through the end of autumn 2020.
Digital cameras, or phenocams, installed in each SPRUCE enclosure track seasonal variation in vegetation “greenness”, a proxy for vegetation phenology and associated physiological activity. Three separate regions of interest (ROIs) were defined for each camera field of view, corresponding to different vegetation types and demarcating (1) Picea trees (vegetation type EN, for evergreen needleleaf); (2) Larix trees (vegetation type DN, for deciduous needleleaf); and (3) the mixed shrub layer (vegetation type SH).
User note: This dataset has been superseded by a later version. For most recent version, please see:
Richardson, A.D., C. Schädel, J. Blais, T. Milliman, K. J. Pearson, M.B. Krassovski, and P.J. Hanson. 2021. SPRUCE Vegetation Phenology in Experimental Plots from Phenocam Imagery, 2015-2022. Oak Ridge National Laboratory, TES SFA, U.S. Department of Energy, Oak Ridge, Tennessee, U.S.A. https://doi.org/ 10.25581/spruce.108/1996813.
User Note: HTML files cannot be viewed in Dropbox, they must be downloaded and opened in a web browser.
-
SPRUCE Ground Observations of Phenology in Experimental Plots, 2020
This data set consists phenological transition dates, as derived from direct observations of vegetative and reproductive phenology recorded by a human observer, from the SPRUCE experiment during 2020, the fifth full year of whole-ecosystem warming (Hanson et al. 2017). Both spring and autumn phenological events are included.
Since April 2016, human observers have been directly tracking the phenology of both woody and herbaceous species on a weekly schedule within the SPRUCE experimental chambers, these data are reported in annual ground observations data sets (see Related Data Sets). The observed date reported here is the first survey date in 2020 on which an event/phenophase was definitively observed.
This data set also has a companion file containing figures showing the relationship between the day of year and temperature treatment for different phenological phases by species for 2020.
User note: Ground observations of phenology from 2016-2021 are available. See SPRUCE Ground Observations of Phenology in Experimental Plots 2021. for the most recent data as well as links to all other ground phenology datasets.
-
SPRUCE Plant-Available Nutrients Assessed with Ion-Exchange Resins in Experimental Plots, Beginning in 2013
These data report observations of plant-available nutrients assessed in ten SPRUCE experimental enclosures and several ambient plots using ion-exchange resin capsules beginning in 2013. Data streams include monthly NH4-N, NO3-N, and PO4 from 2013 (published in Iversen et al. 2018, Plant and Soil), as well as monthly and annual resin-available NH4-N and PO4-P from 2014 – 2018 (published in Iversen et al. 2023).
These data report observations of plant-available nutrients assessed in ten SPRUCE experimental enclosures and several ambient plots using ion-exchange resin capsules beginning in 2013 (2013-06-25 to 2021-12-08). There are three files in comma-separated (*.CSV) format: The first contains monthly resin-available NH4-N, PO4-P, and NO3-N from 2013, which were published in Iversen et al. (2018). The second contains monthly resin-available NH4-N from 2014 - 2021 and PO4-P from 2014 - 2018. It also includes associated peat temperature and distance to water table curated from Hanson et al. (2016 and 2020). These data are published in Iversen et al. (2023) and Petro et al. (2023). The third contains cumulative, annual resin-available NH4-N and PO4-P from 2014 - 2021. These data are published in Iversen et al. (2023) and Petro et al. (2023).
PVC resin-access tubes (allowing repeated, and undisturbed access to the same soil location over time) were installed across hummock and hollow microtopography in the SPRUCE experimental enclosures and ambient plots. Resin capsules were placed into contact with the soil at the base of resin-access tubes and incubated in situ for approximately 28 days before collection and replacement with a new resin capsule. The removed capsules were cleaned, air-dried, and extracted with 2 M potassium chloride. The extractant was analyzed for concentrations of NH4-N, NO3-N, and PO4-P. Nutrient adsorption was standardized per unit of resin capsule surface area and per time interval.
User note: In 2013, data were collected at approximately monthly intervals from four depths in hummock microtopography and two depths in hollow microtopography. In 2014-2018, data include both highly-resolved collections at 28-day timesteps as well as annually summed data at three depths in hummock microtopography and two depths in hollow microtopography. Data will be periodically added to this data set until the conclusion of the SPRUCE experiment.
-
SPRUCE Radiocarbon analyses quantify peat carbon losses with increasing temperature in a whole ecosystem warming experiment, 2014-2020
This data set contains three *.csv data files with measurements of organic and inorganic carbon fractions and radiocarbon fractions in peat porewater profiles. Measurements of carbon fractions from enclosure drainage outflows are also included. Porewater profiles were collected up to four times annually from 2014 to 2020 with a piezometer and outflow samples were collected up to eight times annually in 2016 and 2017. Porewater organic and inorganic fractions were measured using a Finnigan Mat Delta V Isotope Ratio Mass Spectrometer and a Shimadzu Total Organic Carbon. Radiocarbon analyses were conducted at Lawrence Livermore National Laboratory (LLNL). The peat soils were subjected to deep peat heating (DPH) beginning in June of 2014 followed by whole ecosystem warming (WEW) in August of 2015 (Hanson et al. 2017).
-
SPRUCE Compositional Stability of Peat in Ecosystem-Scale Warming Mesocosms, 2014 and 2019
This data set contains measurements of carbohydrate and aromatic compounds in peat samples subjected to various levels of deep peat heating (DPH) and whole ecosystem warming (WEW). Samples were collected in 2014 and 2019 to identify chemical changes occurring within peatland soils following five years of warming. Samples were analyzed in the uppermost 2 m of peat using Fourier Transform Infrared Spectroscopy (FT-IR) to quantify the relative abundance of carbohydrate and aromatic compounds in the peat. The peat soils were subjected to DPH beginning in June of 2014 followed by WEW in August of 2015.
-
SPRUCE Photosynthesis and Respiration of Picea mariana and Larix laricina in SPRUCE Experimental Plots, 2016-2017
Data set contains empirical physiological, morphological, and chemical data collected on two dominant conifer species, Picea mariana and Larix laricina, between May 2016 and August 2017 at the SPRUCE (Spruce and Peatland Responses Under Changing Environments) experiment that assesses the response of peatland ecosystems to whole-ecosystem warming and elevated atmospheric CO2 concentrations. Data reported include: measurements of light-saturated net photosynthesis and dark respiration at ambient atmospheric CO2 concentration (2016), CO2 response curves of light-saturated net photosynthesis (2017), leaf morphology (leaf mass per unit leaf area), and nitrogen content (on both mass and area basis).
-
SPRUCE Warming Promotes the Use of Organic Matter as an Electron Acceptor in a Peatland: Supporting Data
These data are provided in support of the publication: Warming Promotes the Use of Organic Matter as an Electron Acceptor in a Peatland (Rush et al., 2021)
Rush et al. (2021) reported on the effect of temperature on microbial organic matter reduction at the SPRUCE study site and S1 bog. Specifically, electron shuttling capacity (ESC), CH4 production, CO2 production, and acetate concentration were measured to explore both direct and indirect (through changes in soil quality and water-table level) effects of warming on microbial activity. Samples were collected in the summer of 2016 and 2017 depending on the experiment.
-
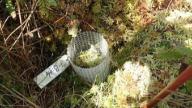
SPRUCE S1 Bog Production of Newly-Grown Fine Roots Assessed Using Root Ingrowth Cores in 2013
Given the ambiguity of distinguishing between living and dead roots in the anaerobic bog environment where dead tissues are highly preserved, root ingrowth cores were used to capture newly-grown fine roots during the 2013 growing season (June - October) at 20 locations at the southern end of the S1-Bog. Rates of fine root production were measured with root ingrowth cores and fine root traits were measured on roots that grew into ingrowth cores. Traits are reported by plant species and root orders and include nitrogen (N) content, root tissue density, specific root length, average diameter.
-
SPRUCE Vertical Profiles of CO2 and H2O Concentrations in Air in Experimental Plots Beginning in 2015
This dataset provides a record of hourly average CO2 and H2O concentrations in air at 4 vertical locations (0.5, 1, 2, and 4 m above ground level (agl)) on the central tower location for each of 13 SPRUCE experimental plots. Ten plots have enclosures (plots 4, 6, 8, 10, 11, 13, 16, 17, 19, and 20) and three plots (5, 7 and 21) are ambient locations without enclosures. Data are included for measurement periods beginning in 2015 and extend throughout the whole ecosystem warming (WEW) manipulations for the SPRUCE Project (Hanson et al. 2016, 2017).
In August 2015, WEW was initiated at 5 warming levels (+0, +2. +4.5, +6.75 and +9 °C) with 2 plots per warming level. Deep peat only heating was underway before the initiation of WEW heating treatments and both are expected to operate through 2025. Elevated CO2 treatments were initiated within 5 experimental plots (Plots 4, 10, 11, 16 and 19) in June of 2016.
-
SPRUCE Plant Tissue Analyses from Experimental Plots Beginning 2017
This data set reports the results of elemental analyses of foliar and stem/woody twig plant tissues collected at the SPRUCE site since 2014. Samples were obtained at various locations around the S1 Bog and from within the experimental treatment plots. These are treatment vegetation samples. The experimental work was conducted in a Picea mariana [black spruce] – Sphagnum spp. bog forest in northern Minnesota, 40 km north of Grand Rapids, in the USDA Forest Service Marcell Experimental Forest (MEF).
-
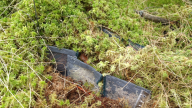
SPRUCE S1 Bog and Bog Lake Fen Moss Decomposition and Litter Chemistry Data, 2014-2019
This data set includes measurements of mass loss, decay rate, and litter chemistry of mosses decomposing in the S1 Bog and Bog Lake Fen located in the USDA Forest Service Marcell Experimental Forest (MEF) in northern Minnesota, 40 km north of Grand Rapids. A litterbag experiment was used to estimate decay rates of 3 different moss types (Sphagnum magellanicum, Sphagnum angustifolium/fallax, and Polytrichum sp.) from mass loss measurements after one and five years in hummock and hollow microtopographies in the bog and lawn microtopography in the poor fen. C, N, and P contents of the mosses were measured initially, after 1 year, and after 5 years of decay. Sample collection and analyses started in 2014 and was completed in 2019. These data are from outside the SPRUCE experimental plots.
-
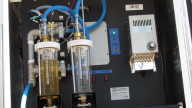
SPRUCE Outflow Chemistry Data for Experimental Plots Beginning in 2016
This data set includes the chemistry of outflow waters in the SPRUCE experiment plots located in the S1 bog of the USDA Forest Service Marcell Experimental Forest (MEF) in northern Minnesota, 40 km north of Grand Rapids. These data are post-treatment data from the warming and elevated carbon dioxide (CO2) treatments associated with the SPRUCE experiment. There are ten experimental plots in SPRUCE: five temperature treatments (+0, +2.25, +4.5, +6.75, +9°C) at ambient CO2, and the same five temperature treatments at elevated CO2 (+500 ppm). Sample collection and analyses started in March of 2016 and will continue for the duration of the experiment.
-
SPRUCE Vegetation Phenology in Experimental Plots from Phenocam Imagery, 2015-2019
This dataset consists of PhenoCam data from the SPRUCE experiment from the beginning of whole ecosystem warming (Hanson et al. 2017) in August 2015 through March-31 of 2020, with start- and end-of-season phenological transition dates derived through the end of autumn 2019. Digital cameras, or phenocams, installed in each SPRUCE enclosure track seasonal variation in vegetation “greenness”, a proxy for vegetation phenology and associated physiological activity. Three separate regions of interest (ROIs) were defined for each camera field of view, corresponding to different vegetation types and demarcating: Picea trees (vegetation type EN, for evergreen needleleaf); Larix trees (vegetation type DN, for deciduous needleleaf); and the mixed shrub layer (vegetation type SH).
User note: This dataset has been superseded by a later version. For most recent version, please see:
Richardson, A.D., C. Schädel, J. Blais, T. Milliman, K. J. Pearson, M.B. Krassovski, and P.J. Hanson. 2021. SPRUCE Vegetation Phenology in Experimental Plots from Phenocam Imagery, 2015-2022. Oak Ridge National Laboratory, TES SFA, U.S. Department of Energy, Oak Ridge, Tennessee, U.S.A. https://doi.org/ 10.25581/spruce.108/1996813.
User Note: HTML files cannot be viewed in Dropbox, they must be downloaded and opened in a web browser.
-
SPRUCE Ground Observations of Phenology in Experimental Plots, 2019
This data set consists of phenological transition dates, as derived from direct observations of vegetative and reproductive phenology recorded by a human observer, from the SPRUCE experiment during 2019, the fourth full year of whole-ecosystem warming (Hanson et al. 2017). Both spring and autumn phenological events are included.
Since April 2016, human observers have been directly tracking the phenology of both woody and herbaceous species on a weekly schedule within the SPRUCE experimental chambers. The observed date reported here is the first survey date on which an event/phenophase was definitively observed.
User note: Ground observations of phenology from 2016-2021 are available. See SPRUCE Ground Observations of Phenology in Experimental Plots 2021. for the most recent data as well as links to all other ground phenology datasets.
-
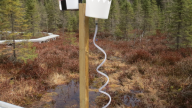
SPRUCE Precipitation Chemistry and Bulk Atmospheric Deposition Beginning in 2013
This data set reports the chemistry of precipitation water that was collected at the SPRUCE site located in the S1 bog and calculated values of bulk atmospheric deposition of solutes in precipitation. Sample collection and analyses started during December of 2013 and will continue for the duration of the experiment. Results will be added to this data set and released to the public periodically as quality assurance and publication of results are accomplished.
-
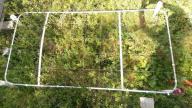
SPRUCE: LAI Data from SPRUCE Experimental Plots, 2017-2019
This dataset provides leaf area index (LAI) data collected across vegetation community plots within the 10 chambered treatment plots (6, 19, 11, 20, 4, 13, 8, 16, 10, 17) and 3 unchambered ambient plots (7, 14, 21) of the SPRUCE experiment project in 2017, 2018, and 2019. The vegetation community plots were established in 2014 and designated to be undisturbed and reserved for long-term sampling. LAI measurements were collected using a LICOR-LAI 2200 instrument over a standard 1x2 meter rectangular sampling frame with 50 20x20 cm grid cells. LAI was measured above the canopy and below the vegetation at the surface of the peat (living sphagnum) in the same grid cells each year.
-
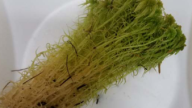
SPRUCE: Sphagnum Carbon, Nitrogen and Phosphorus Concentrations in the SPRUCE Experimental Plots
This data set reports the concentrations of carbon (C), nitrogen (N), and phosphorus (P) in capitula, current year stems, and one-year old stem tissue of Sphagnum from 2016-2018. Measurements are continuing and new data will be appended as they become available.
Three types of Sphagnum were sampled -- S. angustifolium/fallax from hummocks, S. angustifolium/fallax from hollows, and S. magellanicum from hummocks from SPRUCE experimental study plots. Measurements were made in 10 enclosures comprising five levels of temperature elevation in ambient CO2 and five levels in elevated CO2. Measurements also were made in two ambient (no enclosure) plots. Nutrient concentrations were analyzed in conjunction with assessment of Sphagnum growth, which was measured in 3.79-cm diameter mesh columns collected every October and are described in the related dataset (https://doi.org/10.25581/spruce.049/1426474). -
SPRUCE High-Resolution Minirhizotrons in an Experimentally-Warmed Peatland Provide an Unprecedented Glimpse at Fine Roots and their Fungal Partners: Supporting Data
Images were collected using first of their kind, non-destructive, high-resolution automated minirhizotrons (RhizoSystems, LLC) to assess the response of plant fine-root and fungal mycelium dynamics to elevated temperatures after 4-6 years of whole-ecosystem warming and exposure to elevated carbon dioxide concentrations (e[CO2]) in a peat bog where the SPRUCE experiment is located. We focused on two SPRUCE experimental plots: Plot 10 has elevated temperature (+9°C) and plot 19 is a control (+0°C). Both have elevated CO2 (e[CO2]). Changes in root and fungal abundance with warming were estimated from a timeseries of landscape-level mosaiced images for each plot by measuring the proportional abundance of five belowground classes: fine roots of vascular plants, ectomycorrhizas, fungal hyphae, fungal rhizomorphs, and fungal sporocarps. To examine root and fungal phenology responses to warming, the length per individual root or fungal structure areal coverage were measured per image area of a set of timeseries patch-level mosaiced images for each plot. These data are provided in support of the publication: High-Resolution Minirhizotrons in an Experimentally-Warmed Peatland Provide an Unprecedented Glimpse at Fine Roots and their Fungal Partners (Defrenne et al., In review)
-
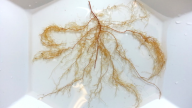
SPRUCE Production and Chemistry of Newly-Grown Fine Roots Assessed Using Root Ingrowth Cores in SPRUCE Experimental Plots beginning in 2014
This dataset reports growth and chemistry of newly-grown fine roots from root ingrowth cores in the SPRUCE experimental enclosures. There is one comma separated file (.csv) that provides fine-root growth and chemistry data for the ten SPRUCE experimental enclosures from years 2014 to 2017. These data were used to assess the warming and elevated CO2 response of fine roots and also capture responses across microtopographical features and plant types.
-

SPRUCE Large-Collar In Situ CO2 and CH4 Flux Data for the SPRUCE Experimental Plots: Whole-Ecosystem-Warming
This data set reports community-level CO2 and CH4 flux measurements for the SPRUCE experimental study plots located in the S1-Bog. Surface flux measurements of CO2 and CH4 were made using open-path analyzers over an area of 1.13 m2 within each of 16 plots. A custom-designed chamber encloses the hummock-hollow topography and allows point in time measurements of the shrub, forb, Sphagnum spp. and the complex microbial community. These observations were made with ambient light and imposed dark conditions to allow estimates of community daytime and night respiratory processes. This data set is all inclusive – beginning in 2011 and continuing through October 2021 of the Whole-Ecosystem-Warming (WEW) phase of the experiment.
-
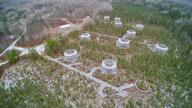
SPRUCE S1 Bog and SPRUCE Experiment Aerial Photographs
This data set provides a record of the aerial photographs taken of the S1-Bog on the Marcell Experimental Forest and the SPRUCE experimental site within the S1-Bog. New 2019-2020 photos collected from UAV have been added.
-
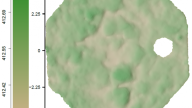
SPRUCE Microtopography of Experimental Plots Derived from Terrestrial Laser Scans Beginning in 2016
This dataset consists of maps and summaries of very high resolution (1 cm2) spatial data derived from terrestrial laser scans (TLS) characterizing the microtopography (hummocks and hollows) in 12 SPRUCE experimental plots from 2016-2018. The SPRUCE experiment is located in the S1-Bog of the Marcell Experimental Forest (MEF) near Grand Rapids, Minnesota. Additional data will be added through Summer 2021.
In the spring of each year, four TLS scans were taken per plot/enclosure and registered together to produce a single point cloud for each plot. Digital surface models (DSMs) were generated from the point clouds and clipped to the inside boundary of the boardwalk in each plot resulting in an approximately 9 x 9 m study area.
All other characterization data types were derived from plot DSMs (elevation), including: slope, concavity, index used for microform classification (Hollow Index), and microforms (hummocks and hollows) classified using three methodologies.
-
SPRUCE Photosynthesis and Respiration of Rhododendron groenlandicum and Chamaedaphne calyculata in SPRUCE Experimental Plots, 2016
This data set contains biochemical and physiological data collected between June 2016 and May 2017 on two ericaceous shrub species, Chamadaphne calyculata and Rhododendron groenlandicum, at the SPRUCE (Spruce and Peatland Responses under Changing Environments) experiment to assess the response of peatland ecosystems to increases in whole ecosystem temperatures and elevated atmospheric CO2 concentrations.The SPRUCE experiment is located 40 km north of Grand Rapids, MN, in the USDA Forest Service Marcell Experimental Forest.
-
SPRUCE Ground Observations of Phenology in Experimental Plots, 2018
This data set consists of phenological transition dates, as derived from direct observations of vegetative and reproductive phenology recorded by a human observer, from the SPRUCE experiment during 2018, the third full year of whole-ecosystem warming (Hanson et al. 2017). Both spring and autumn phenological events are included.
Since April 2016, human observers have been directly tracking the phenology of both woody and herbaceous species on a weekly schedule within the SPRUCE experimental chambers. The observed date report here is the first survey date on which an event/phenophase was definitively observed.
User note: Ground observations of phenology from 2016-2021 are available. See SPRUCE Ground Observations of Phenology in Experimental Plots 2021 for the most recent data as well as links to all other ground phenology datasets.
-

SPRUCE Vegetation Phenology in Experimental Plots from Phenocam Imagery, 2015-2018
This dataset consists of PhenoCam data from the SPRUCE experiment from the beginning of whole ecosystem warming (Hanson et al. 2017) in August 2015 through March-31 of 2019, with start- and end-of-season phenological transition dates derived through the end of autumn 2018.
Digital cameras, or phenocams, installed in each SPRUCE enclosure track seasonal variation in vegetation “greenness”, a proxy for vegetation phenology and associated physiological activity. Three separate regions of interest (ROIs) were defined for each camera field of view, corresponding to different vegetation types and demarcating: Picea trees (vegetation type EN, for evergreen needleleaf); Larix trees (vegetation type DN, for deciduous needleleaf); and the mixed shrub layer (vegetation type SH).
User note: This dataset has been superseded by a later version. For most recent version, please see:
Richardson, A.D., C. Schädel, J. Blais, T. Milliman, K. J. Pearson, M.B. Krassovski, and P.J. Hanson. 2021. SPRUCE Vegetation Phenology in Experimental Plots from Phenocam Imagery, 2015-2022. Oak Ridge National Laboratory, TES SFA, U.S. Department of Energy, Oak Ridge, Tennessee, U.S.A. https://doi.org/ 10.25581/spruce.108/1996813.
User Note: HTML files cannot be viewed in Dropbox, they must be downloaded and opened in a web browser.
-
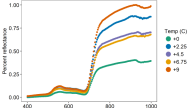
SPRUCE: Hyperspectral Remote Sensing of Vegetation Communities in SPRUCE Experimental Plots, 2016
This data set consists of reflectance observations from hyperspectral remote sensing of the vegetation communities in SPRUCE experimental study plots located in the S1-Bog. Community vegetation plots in ten chambered treatment plots (6, 19, 11, 20, 4, 13, 8, 16, 10, 17) and 3 unchambered ambient plots (7, 14, 21) were scanned. Spectral data were collected on 22 September 2016 under clear sky conditions beginning at 1:00 p.m. local time. Although it was past peak growing season, senescence had only just begun at the site, and experimentally warmed plots were still near peak growing conditions.
-
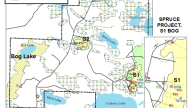
SPRUCE Tritium in Porewater of SPRUCE Experimental Plots and Neighboring Peatlands, and in Groundwater, Stream Water, and Precipitation of the S1 Bog, 2014-2016
This data set reports the tritium concentrations in (1) porewater from selected SPRUCE experimental plots located in the S1 bog and in (2) groundwater, streamwater, and precipitation in the S1 bog watershed, and (3) in porewater from the S2 bog, S3 fen, and Bog Lake fen. All sites are located at the USDA Forest Service, Marcell Experimental Forest (MEF) near Grand Rapids, MN. Samples were collected between June of 2014 and August of 2016.
These data include samples collected pre- and post- belowground warming treatments associated with the SPRUCE Experiment. There are 10 experimental plots in SPRUCE: 5 temperature treatments (+0, +2.25, +4.5, +6.75, +9°C) at ambient CO2, and the same 5 temperature treatments at elevated CO2 (+500 ppm).
Porewater samples in this dataset were collected from three of the warming treatment plots (+0, +4.5, +9°C) at ambient CO2.
-
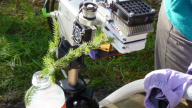
SPRUCE S1 Bog Pretreatment Seasonal Photosynthesis and Respiration of Trees, Shrubs, and Herbaceous Plants, 2010-2015
This data set contains the empirical biochemical, morphological, and physiological data collected between 2010 and 2015 on an herb (Maianthemum trifolium), understory shrubs (Rhododendron groenlandicum, Chamaedaphne calyculata, Kalmia polifolia and Vaccinium angustifolium) and overstory trees (Picea mariana and Larix laricina) in the S1-Bog at the USDA Forest Service Marcell Experimental Forest (MEF) in northern Minnesota, USA. Data reported include the measurements of photosynthetic light and CO2 response curves, and dark respiration, as applied to standardized curve-fitting programs to estimate biochemical parameters.
-
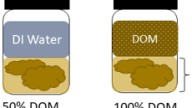
SPRUCE Does dissolved organic matter or solid peat fuel anerobic respiration in peatlands?: Supporting Data
Hopple et al. (2019) investigated whether, as a primary substrate – dissolved organic matter (DOM) or solid peat – was driving anaerobic respiration at surface and at deep depth increments within two bogs and a poor fen in northern Minnesota. To address this question, they used a combination of soil laboratory incubations, as well as in-situ analyses of porewater dissolved organic carbon (DOC) concentrations and specific UV absorbance (SUVA) measurements. Soil samples were collected in June 2013 and July 2014, while porewater samples were taken in July 2013. Data provided include: porewater DOC concentration and SUVA values, soil CH4 and CO2 potential production rates from peat samples exposed to varying DOM concentrations, and soil CH4 and CO2 potential production rates.These data are provided in support of the publication: Does dissolved organic matter or solid peat fuel anerobic respiration in peatlands? (Hopple et al., 2019)
-
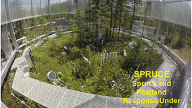
SPRUCE Total Gaseous Mercury Fluxes and Peat Mercury Concentrations, 2014-2015
This data set reports the results of total gaseous mercury (TGM) flux monitoring conducted in a sub-set of the SPRUCE experimental study enclosures (Plots 4, 6, 10, 13, 17 and 19) located in the S1 Bog. These plots were selected to represent duplicates of the +0, +4.5 and +9°C experimental temperature treatments. Monitoring of TGM fluxes was conducted in May-June 2014, August 2014 and June 2015 to capture the influence of the deep (2 m below the ground surface) peat warming experiment. These sampling events were conducted prior to the initiation of deep peat warming (May-June 2014), once target peat temperatures were achieved at depth (August 2014) and at the conclusion of the deep warming experiment prior to the initiation of whole ecosystem warming (June 2015).
This data set also presents the total mercury (Hg) concentration for peat samples collected during the group sampling campaigns, involving a team of SPRUCE investigators and collaborators, in June 2014 (prior to deep peat warming experiment), September 2014 (target temperatures achieved at depth) and June 2015 (end of deep warming experiment and prior to whole ecosystem warming). Peat samples for total mercury analysis were collected from Enclosures 4, 6, 8, 10, 11, 13, 16, 17, 19, 20.
-
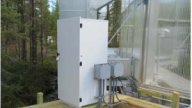
SPRUCE Outflow Total Mercury and Methylmercury from Experimental Plots, Beginning in 2017
This data set reports the results of total mercury and methylmercury analyses of the chemical analyses of outflow samples from the SPRUCE experimental study plots located in the S1-Bog. Sample collection and analyses started in April of 2017 and will continue for the duration of the experiment. Data will be added to this data set and released to the public periodically as quality assurance and publication of results are accomplished.
-
SPRUCE Porewater Total Mercury and Methylmercury from Experimental Plots, Beginning in 2016
This data set reports the results of total mercury and methylmercury analyses of porewater samples from the SPRUCE experimental study plots located in the S1-Bog. Sample collection and analyses started in June of 2016 and will continue for the duration of the experiment. Data will be added to this data set and released to the public periodically as quality assurance and publication of results are accomplished.
-
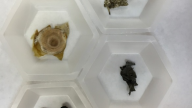
SPRUCE Fungal Necromass Litter Bag Decomposition Study in SPRUCE Experimental Plots, 2016-2018
This data set provided the results of a 2-year fungal necromass litter bag decomposition study at the Spruce and Peatland Responses Under Changing Environments (SPRUCE) experiment in the Marcell Experimental Forest in northern Minnesota, USA. Necromass from four mycorrhizal fungal species that naturally occur and associate with either the ectomycorrhizal (EM) tree hosts or ericoid mycorrhizal (ERM) shrubs in the S1 Bog site and vary in melanin content (Cenococcum geophilum Fr., Suillus grisellus, Meliniomyces bicolor, and Oideodendron griseum) were incubated in situ in SPRUCE experimental treatment chambers for 3, 12, and 24 months duration beginning in June of 2016 and ending in June of 2018. Analyses of the necromass included pre-incubation chemistry and post-incubation mass loss and Fourier transform infrared (FTIR) spectroscopy of remaining fungal necromass.
-
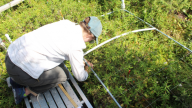
SPRUCE: Vegetation Community Survey Data from SPRUCE Experimental Plots, 2014-2020
This dataset provides vegetation survey data collected across vegetation community plots within the 10 chambered treatment plots (6, 19, 11, 20, 4, 13, 8, 16, 10, 17) and 3 unchambered ambient plots (7, 14, 21) of the SPRUCE experiment project in 2014-2020. The vegetation community plots, three in each experimental plot, were established in 2014 and designated to be undisturbed and reserved for long-term sampling. Vegetation survey data were collected at the peak of each growing season by placing a 1x2 meter rectangular grid over each community plot. The 1x2 meter grid is subset into 50 20x20 cm grid cells. Observations are of the presence of each species in each grid cell for each subplot. In 2018 and 2019, shrub stem density was counted and percent shrub cover was estimated in five selected grid cells in each vegetation community plot. Also included are photographs of each community plot taken at the time of data collection for each measurement year.
-
SPRUCE Deep Peat Heating (DPH) Environmental Data, February 2014 through July 2015
This data set provides a record of the half-hourly automated environmental data collected for 14 SPRUCE plots (4, 5, 6, 7, 8, 10, 11, 13, 14, 16, 17, 19, 20, and 21) during the Deep Peat Heating (DPH) study. In June 2014, deep soil heating was initiated at 5 warming levels (+0, +2.25, +4.5, +6.75 and +9 °C) with 2 replicate plots per level. Measurements were underway before the initiation of heating treatments and continued through July 27 of 2015 at the transition to whole-ecosystem warming manipulations.
-
SPRUCE: NDVI Data from Selected SPRUCE Experimental Plots, 2016-2018
This data set consists of observations of Normalized Difference Vegetation Index (NDVI) collected via stationary sensors positioned 1.5 meter above unobstructed areas of the ground layer. Sensors were installed above undisturbed community composition plots, that are not instrumented or destructively sampled in any way, in six of the ten chambered SPRUCE experimental study plots located in the S1-Bog. Spectral data (630 and 800 nanometers) were collected at 10-minute intervals over a field of view of ~53 cm in diameter beginning May 6, 2016. Data collection ended at a different time for each sensor as batteries discharged – ranging from January 1, 2018 to April 1, 2018.
-
SPRUCE Small Differences in Ombrotrophy Control Regional-Scale Variation in Methane Cycling among Sphagnum-Dominated Peatlands: Supporting Data
These data are provided in support of the SPRUCE publication: Small Differences in Ombrotrophy Control Regional-Scale Variation in Methane Cycling among Sphagnum-Dominated Peatlands (Zalman et al., 2018). Reports on the mechanisms controlling C cycling rates and greenhouse gas emissions using a combination of biogeochemical and microbial approaches in three low pH, Sphagnum-dominated peatlands in northern Minnesota. In particular, biogeochemical parameters (CH4 and CO2 production potentials, porewater and gas CH4 and CO2 concentrations, and associated isotopic signatures), soil chemistry (organic acids and phenolics), and microbial community characteristics (quantification of methanogen and methanotroph abundance and activity) over a 1-year period in these three peatlands. Samples were collected from June of 2013 to June of 2014.
-
SPRUCE S1 Bog Seasonal Patterns of Nonstructural Carbohydrates in Larix, Picea, Rhododendron, and Chamaedaphne, 2013
This dataset reports the results of nonstructural carbohydrate (NSC) analyses of foliage/twig/root tissues collected at the SPRUCE site in 2013. Samples were obtained at various locations around the S1 Bog. These are pretreatment vegetation samples, collected prior to initiation of the SPRUCE experiment heating and elevated CO2 treatments.
-
SPRUCE Enclosure Corral and Sump System: Description, Operation, and Calibration
A subsurface corral system has been designed and constructed to measure water flow and allow the collection of water samples from the outflow of each experimental enclosure within the SPRUCE project. These measurements are critical to the calculation of whole-ecosystem water, carbon, and solute effluxes. This document provides a description of the components, operation, and calibration of the corral system.
-
SPRUCE: Sphagnum Productivity and Community Composition in the SPRUCE Experimental Plots
This data set reports annual dry matter production of Sphagnum in replicated growth columns, the composition of the moss community, and plot-average Sphagnum productivity in the SPRUCE experimental study plots located in the S1-Bog following whole ecosystem warming and deep peat heating (Hanson et al., 2017). Data are reported for the 2016 - 2021 growing seasons (growing seasons run October to October, e.g. the 2016 growing season was October 2015 to October 2016). Data are contained in three comma separated (*.csv) files. Additional data will be appended as they become available.
-
SPRUCE Vegetation Phenology in Experimental Plots from Phenocam Imagery, 2015-2017
This data set consists of PhenoCam data from the SPRUCE experiment from the beginning of whole ecosystem warming in August 2015 through the end of 2017. Digital cameras, or phenocams, installed in each SPRUCE enclosure track seasonal variation in vegetation “greenness”, a proxy for vegetation phenology and associated physiological activity. Regions of interest (ROIs) were defined for vegetation types (1) Picea trees (EN, evergreen needleleaf); (2) Larix trees (DN, deciduous needleleaf); and (3) the mixed shrub layer (SH, shrubs).
User note: This dataset has been superseded by a later version. For most recent version, please see:
Richardson, A.D., C. Schädel, J. Blais, T. Milliman, K. J. Pearson, M.B. Krassovski, and P.J. Hanson. 2021. SPRUCE Vegetation Phenology in Experimental Plots from Phenocam Imagery, 2015-2022. Oak Ridge National Laboratory, TES SFA, U.S. Department of Energy, Oak Ridge, Tennessee, U.S.A. https://doi.org/10.25581/spruce.108/1996813.
-
SPRUCE Ground Observations of Phenology in Experimental Plots, 2016-2017
This data set consists of phenological transition dates, as derived from direct observations of vegetative and reproductive phenology recorded by a human observer, from the SPRUCE experiment during the 2+ years (August 2015 through December 2017) of whole-ecosystem warming. For 2016, only springtime (April - June) phenological events are included. For 2017 (April - December), spring and autumn events are included.
Beginning in April 2016, human observers have been directly tracking the phenology of both woody and herbaceous species on a weekly schedule within the SPRUCE experimental chambers. The observed date report here is the first survey date on which an event/phenophase was definitively observed.
User note: Ground observations of phenology from 2016-2021 are available. See SPRUCE Ground Observations of Phenology in Experimental Plots 2021 for the most recent data as well as links to all other ground phenology datasets.
-
SPRUCE Deep Peat Heating (DPH) to Whole Ecosystem Warming (WEW) Metagenomes for Peat Samples Collected June 2016
This data set provides links to the results of metagenomic analyses of 44 peat samples collected on 13 June 2016 from SPRUCE experiment treatment and ambient plots. Experimental plots had received approximately 24 months of belowground warming (deep peat heating (DPH), Hanson et al. 2015) with the last 9 of those months including air warming for implementation of whole ecosystems warming (WEW – Hanson et al. 2016). Data from these metagenomes are archived in the U.S. Department of Energy Joint Genome Institute (DOE JGI) Integrated Microbial Genomes (IMG) system. Link: https://img.jgi.doe.gov/cgi-bin/m/main.cgi. Quick Genome Search: June2016WEW.
-
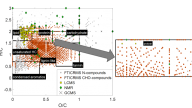
SPRUCE Advanced Molecular Techniques Provide a Rigorous Method for Characterizing Organic Matter Quality in Complex Systems: Supporting Data
These data are provided in support of the Commentary, Advanced molecular techniques provide a rigorous method for characterizing organic matter quality in complex systems, Wilson and Tfaily (2018).
Measurement results demonstrate that optical characterization of peatland dissolved organic matter (DOM) may not fully capture classically identified chemical characteristics and may, therefore, not be the best measure of organic matter quality.
Results of analyses of a representative sample by FTICRMS and additional analytical techniques provide a broader picture of the compounds occurring in peatland DOM.
-

SPRUCE Epiphytic Lichen Annual Biomass Growth in Experimental Plots, 2013-2016
This data set provides annual biomass growth rates of epiphytic lichen transplants in the SPRUCE experimental plots at the S1 Bog of the Marcell Experimental Forest. Epiphytic lichens (Evernia mesomorpha, a boreal forest indicator species) were collected at S1 Bog outside the experimental enclosures and mounted on Picea mariana branches inside the 10 experimental enclosures and the 2 ambient plots without enclosures using transplant techniques. Lichen transplants were weighed annually, in August of 2013-2016, to measure biomass growth rates as a function of experimental temperature and CO2 treatments.
-
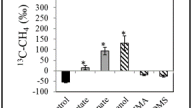
SPRUCE Methylotrophic Methanogenesis in Sphagnum-dominated Peatland Soils – CH4 and CO2 Production in Laboratory Incubations
This study investigated the potential for methylotrophic methanogenesis in three Sphagnum-dominated peatland soils in northern Minnesota. Collected soils were amended with 13C-labeled traditional substrates (acetate and sodium bicarbonate/ H2) and methylated substrates (methanol, monomethylamine (“MMA”), dimethylsulfide (“DMS”)) and monitored for δ13C-CH4, δ 13C-CO2, and net CH4 and CO2 production in laboratory incubations.
-
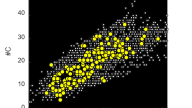
SPRUCE Geochemical Changes in Porewater from Northern Peatlands at Multiple Depths in Field Samples and over Time in Peat Incubations
This data set reports the results of the analysis of dissolved organic matter (DOM) in porewater samples collected from multiple depths in northern peatlands and during laboratory peat incubations to characterize the gain or loss of specific chemical moieties (e.g. CH2, H2, CH2O, etc.) that may be attributed to microbial degradation. During incubations, CO2 and CH4 concentrations and stable isotopes were determined by isotope ratio mass spectrometry.
-
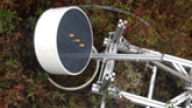
Autochamber CO2 and CH4 Flux Data for the SPRUCE Experimental Plots
This data set reports measurements of CO2 and CH4 fluxes and d13C-CO2 and d13C-CH4 values associated with each flux measurement for the SPRUCE experimental study plots located in the S1-Bog. Flux measurements started in 2014 and are continuing.
-
SPRUCE Deep Peat Microbial Diversity, CO2 and CH4 Production in Response to Nutrient, Temperature, and pH Treatments during Incubation Studies
This data set contains the results of a microcosm incubation study on deep peat collected from the SPRUCE experimental site in the S1 Bog in September 2014. Microcosms were monitored for CO2 and CH4 production, and microbial community dynamics were assessed using qPCR and amplicon sequencing.
The experiment was designed with a full factorial design with elevated temperature, nitrogen (N), (P), and pH treatments was used with samples from each transect serving replicates. In all, 96 microcosms were constructed to account for the 16 treatment combinations (N x P x pH x temperature), 2 time points, and 3 replicates. Temperature treatments were 6 °C, to mimic the SPRUCE ambient plot temperatures, and 15 °C to mimic the SPRUCE +9 °C treatment.
-
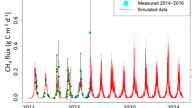
SPRUCE Data-constrained Projections of Methane Fluxes in a Northern Minnesota Peatland in Response to Elevated CO2 and Warming: Modeling Archive
Study developed a data-informed process-based model using methane chamber measurement data from the SPRUCE project experiment in a northern peatland in northern Minnesota. Study used existing manual CH4 flux measurements collected from the ambient environment from 2011-2014 and developed a data-informed process-based methane module. The module was incorporated into the Terrestrial ECOsystem (TECO) model before its parameters were constrained with multiple years of methane flux data for forecasting CH4 emission under five warming and two elevated CO2 experimental treatments at SPRUCE. Included in this model archive are the (1) source code of the TECO model used in the study (2) the posterior distribution of parameters values, and (3) model simulated results of methane emission for different pathways under different environmental conditions.
-
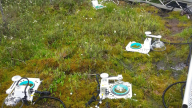
SPRUCE S1 Bog Sphagnum CO2 Flux Measurements and Partitioning into Re and GPP
This data set provides (1) the results of in-situ Sphagnum-peat hourly net ecosystem exchange (NEE) measured using a LICOR 8100 gas exchange system and (2) the component fluxes -- gross primary production (GPP) and ecosystem respiration (Re), derived using empirical regressions.
NEE measurements were made from 6 June to 6 November 2014 and 20 March to 10 May 2015. Three 8100 chambers per dominant species (S. magellanicum or S. fallax) were placed in the S1 Bog in relatively open ground where there was no obvious hummock-hollow microtopography. The 8100 chambers were not located in the SPRUCE experimental enclosures.
-
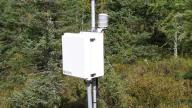
SPRUCE Environmental Monitoring Data: 2010-2016
This data set reports selected ambient environmental monitoring data (public) from the S1 bog for the period June 2010 through 2016. Measurements of the environmental conditions at these stations will serve as a pre-treatment baseline for experimental treatments and provide driver data for future modeling activities.
-
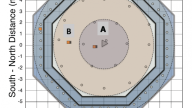
SPRUCE Whole Ecosystem Warming (WEW) Peat Water Content Experimental Plot Cores Beginning June 2016
This data set provides the peat water content and peat temperature at time of sampling for peat cores collected before and during the SPRUCE Whole Ecosystem Warming (WEW) study.
Cores for the current data set were collected during the following bulk peat sampling events: 13 June 2016 and 23 August 2016. Over time, this dataset will be updated with each new major bulk peat sampling event, and dates/methods will be updated accordingly.
-
SPRUCE S1 Bog Pretreatment Fungal Hyphae Carbon and Nitrogen Concentrations and Stable Isotope Composition from In-growth Cores, 2013-2014
This data set reports fungal hyphal carbon and nitrogen concentrations and δ13C, and δ15N data for samples obtained from in-growth cores in the S1 Bog. Hyphae were collected using 40 μm in-growth bags (10 cm × 10 cm) filled with sterile sand. Bags were incubated in the field in paired hummock and hollows at six locations in the bog. In hummocks, bags were inserted at +10 to 0 cm above the adjacent hollow and in both locations from 0 to -10 cm and -10 to -20 cm below the hollow surface.
-
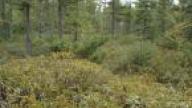
SPRUCE Pretreatment Plant Tissue Analyses, 2009 through 2013
This data set reports the results of elemental analyses of foliar and stem/woody twig plant tissues collected at the SPRUCE site in 2009, 2012, and 2013. Samples were obtained at various locations around the S1 Bog and from within the developing experimental treatment plots. These are pretreatment vegetation samples, collected prior to initiation of the SPRUCE experiment heating and elevated CO2 treatments.
The experimental work was conducted in a Picea mariana [black spruce] – Sphagnum spp. bog forest in northern Minnesota, 40 km north of Grand Rapids, in the USDA Forest Service Marcell Experimental Forest (MEF).
-
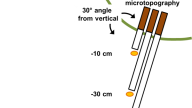
SPRUCE S1 Bog Plant-Available Nutrients Assessed with Ion-Exchange Resins from 2011-2012 in the Southern End of the S1 Bog
This data set consists of observations of plant-available nutrients assessed using ion-exchange resin capsules incubated serially in aerobic and anaerobic peat layers beginning in 2011. Data were collected from 2011 to 2012 (prior to the construction of the SPRUCE experimental plots) at the southern end of the S1 Bog at three depths in hollow microtopography only. The experimental work was conducted in a Picea mariana [black spruce] – Sphagnum spp. bog forest in northern Minnesota, 40 km north of Grand Rapids, in the USDA Forest Service Marcell Experimental Forest (MEF).
-
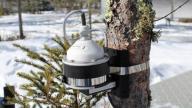
SPRUCE S1 Bog Tree Basal Area and Understory Community Composition Assessed in the Southern and Northern Ends of the S1 Bog
The composition and cover of woody and understory species, along with the timing of stem growth, were characterized near minirhizotron installations at the south and north ends of the S1 bog in order to understand the relationship between root dynamics and the surrounding plant communities.
There are three data streams:
(1) Woody species basal area -- the number, basal area, and distance from the center point of all trees within a 5-m radius of each minirhizotron pair, which were quantified in 2011,
(2) Understory cover -- the understory vascular plant community composition and percent cover, which were surveyed in 1 m2 areas at four cardinal directions adjacent to each pair of minirhizotrons in June 2011, and
(3) Stem growth -- the basal area increment (stem growth) of nearby trees, which was quantified using automated or manual dendrobands in 2011 and 2012, respectively. -
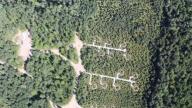
SPRUCE S1 Bog Areal Coverage of Hummock and Hollow Microtopography Assessed Along Three Transects in the S1 Bog
Aerial coverage of hummocks and hollows was estimated in July 2012 in ten 4 m × 4 m plots each along three 60-m t transects (30 plots total) in the S1-Bog. Hollows were defined as the lowest elevation within plots and were typically at or near the height of the water table, hummocks included area above hollows, including the sides of the hummocks.
The experimental work was conducted in a Picea mariana [black spruce] – Sphagnum spp. bog forest in northern Minnesota, 40 km north of Grand Rapids, in the USDA Forest Service Marcell Experimental Forest (MEF).
-
SPRUCE S1 Bog Fine-root Production and Standing Crop Assessed with Minirhizotrons in the Southern and Northern Ends of the S1 Bog
This data set reports fine-root peak growth and standing crop measurements from a forested, ombrotrophic bog as determined using non-destructive minirhizotron technology. Minirhizotron images were collected throughout the growing seasons of 2011 and 2012 at the southern and northern ends of the S1 bog across gradients of tree density in paired hummock and hollow microtopography. The dominant woody species in the bog, and focus of the investigation, were trees Picea mariana and Larix laricina, and ericaceous shrubs Rhododendron groenlandicum and Chamaedaphne calyculata. The measurements were made in the S1 Bog, a Picea mariana [black spruce] – Sphagnum spp. bog forest in northern Minnesota, 40 km north of Grand Rapids, in the USDA Forest Service Marcell Experimental Forest (MEF).
-
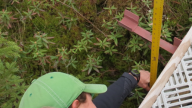
SPRUCE Hollow Elevation Data for Experimental Plots Beginning in 2015
This data set provides hollow elevation data for the 17 SPRUCE experimental plots in the S1 bog on the Marcell Experimental Forest.
Hollows were selected for measurement by walking along each octagonal boardwalk segment in a plot and identifying where a hollow intersected the boardwalk. The vertical distance between the surface of the boardwalk (with a known elevation) and the surface of the hollow was measured and the absolute elevation (in meters amsl) of the hollow surface was calculated.
The hollow elevation measurements were carried out in October 2015, May 2016, October 2016, April 2017, and August 2018. These measurements will be repeated annually or more frequently.
-
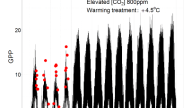
SPRUCE Ecological Forecasting System
EcoPAD is an interactive Model-Experiment (ModEx) system that assimilates various data streams into models in a rigorous way to constrain model parameters and system states, improve ecological prediction, and quantify associated uncertainty. The system provides feedback to experimenters on which data sets are needed to further improve model predictions and to modelers on which parts of a model need to be improved.
Specifically, the system will
- Predict what ecosystems may respond to treatments once you selected a site and decide your experimental plan.
- Assimilate data you are collecting along your experiment to constrain model prediction.
- Project what ecosystem responses may likely be in the rest of your experiment.
- Tell you what are those important datasets you may want to collect in order to understand the system.
- Periodically update the projections.
- Improve the models, the data assimilation system, and your experiments during the process.
EcoLAB assimilates multiple streams of data from the SPRUCE experiment to the TECO model using MCMC algorithm, and then makes forecasts of ecosystem dynamics. Effects of warming and elevated [CO2] on carbon fluxes and pool sizes are forecast.
Forecasting of GPP and ER are automated at weekly timescale. Mean trajectory and confidence interval were derived from 100 stochastic simulations. In each simulation, parameters were randomly chosen from previous (or default) Data Assimilation task. Forcing variables linked to SPRUCE ftp site where updated hourly.
-
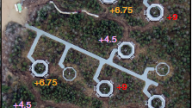
SPRUCE Stability of Peatland Carbon to Rising Temperatures: Supporting Data
These data are provided in support of the SPRUCE publication, Stability of peatland carbon to rising temperatures, Wilson et al., (2016).
This data set reports the results of extensive field measurements and laboratory analyses of samples from the SPRUCE experiment. Results indicate that ecosystem-scale warming of over 2 m of peat exponentially increased CH4 emissions —but not ecosystem respiration of CO2. Multiple lines of evidence, including incubations and in situ analyses of 14C, dissolved gases, and microbial community metabolic potential, indicate that CH4 emissions increased due to surface processes and not degradation of deeper buried carbon.
The supporting data provided include the summarized and aggregated data used to generate the six figures in the main text of the paper and the 12 supplementary figures.
-
SPRUCE Peat Physical and Chemical Characteristics from Experimental Plot Cores, 2012
This data set reports the results of physical and chemical analyses of peat core samples from the SPRUCE experimental study plots located in the S1-Bog.
On August 13-15, 2012, a team of SPRUCE investigators and collaborators collected core samples of peat in the SPRUCE experimental plots. The goal was to characterize the biological, physical, and chemical characteristics of peat, and how those characteristics changed throughout the depth profile of the bog, prior to the initialization of the SPRUCE experimental warming and CO2 treatments.
Cores were collected from 16 experimental plots; samples were collected from the hummock and hollow surfaces to depths of 200-300 cm in defined increments. Three replicate cores were collected from both hummock and hollow locations in each plot. The coring locations within each plot were mapped.
User note: Related data containing characteristics of peat following a similar methodology collected 5 years post-treatment (2020-21), as well as a summary of data contained in this dataset are available, please see SPRUCE Peat Physical and Chemical Characteristics from Experimental Plot Cores, Select Pre-Treatment 2012 and Post-Treatment 2020-21.
-
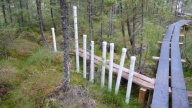
SPRUCE S1 Bog Porewater, Groundwater, and Stream Chemistry Data: 2011-2013
This data set reports the chemistry of S1 Bog porewater, outlet stream water, and groundwater from upland wells from 2011 through 2013. These data provide information for studies of the biogeochemical status of the bog and surrounding groundwater aquifer.
The data have been analyzed and reported on in the following paper: Griffiths, N.A. and S.D. Sebestyen. 2016. Dynamic vertical profiles of peat porewater chemistry in a northern peatland. Wetlands, 36:1119–1130, DOI 10.1007/s13157-016-0829-5
-

SPRUCE Deep Peat Heat (DPH) Metagenomes for Peat Samples Collected June 2015
This data set provides links to the results of metagenomic analyses of 38 peat core samples collected on 16 June 2015 from SPRUCE experiment treatment plots after approximately one year of belowground heating. These metagenomes are archived in the U.S. Department of Energy Joint Genome Institute (DOE JGI) Integrated Microbial Genomes (IMG) system and are available at the accession numbers provided in the accompanying inventory file.
-
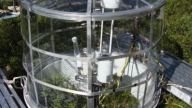
SPRUCE Large-Collar In Situ CO2 and CH4 Flux Data for the SPRUCE Experimental Plots
This data set reports community-level CO2 and CH4 flux measurements for the SPRUCE experimental study plots located in the S1-Bog. Surface flux measurements of CO2 and CH4 were made using open-path analyzers over an area of 1.13 m2 within each of 16 plots. A custom-designed chamber encloses the hummock-hollow topography and allows point in time measurements of the shrub, forb, Sphagnum spp. and the complex microbial community. These observations were made with ambient light and imposed dark conditions to allow estimates of community daytime and night respiratory processes. Measurements were collected seasonally starting in 2011 and have continued through 2016. Data collection will continue and the new data will be added periodically.
-
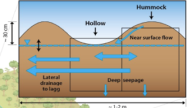
SPRUCE Representing Northern Peatland Microtopography and Hydrology within the Community Land Model: Modeling Archive
Here we provide model code, inputs, outputs and evaluation datasets for a new configuration of the Community Land Model (CLM) for SPRUCE, which includes a fully prognostic water table calculation for SPRUCE.
Our structural and process changes to CLM focus on modifications needed to represent the hydrologic cycle of bogs environment with perched water tables, as well as distinct hydrologic dynamics and vegetation communities of the raised hummock and sunken hollow microtopography characteristic of SPRUCE and other peatland bogs. The modified model was parameterized and independently evaluated against observations from an ombrotrophic raised-dome bog in northern Minnesota (S1-Bog), the site for the Spruce and Peatland Responses Under Climatic and Environmental Change experiment (SPRUCE).
-
SPRUCE S1 Bog and SPRUCE Experiment Location Survey Results, 2015 and 2020
This data set provides results from two horizontal and vertical surveys (2015, 2020) of SPRUCE experimental infrastructure and measurement locations on the S1 bog on the Marcell Experimental Forest and the SPRUCE experimental site within the S1 bog.
-
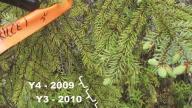
SPRUCE S1 Bog Pretreatment Photosynthesis and Respiration for Black Spruce: 2010-2013
This data set contains biochemical, morphological, and physiological data collected between 2010 and 2013 on mature black spruce (Picea mariana) trees at the S1 bog site in northern Minnesota, located 40 km north of Grand Rapids in the USDA Forest Service Marcell Experimental Forest (MEF). These data were collected prior to the initiating of heating and elevation of CO2 for the SPRUCE experiment to assess the response of northern peatland ecosystems to increases in temperature and exposures to elevated atmospheric CO2 concentrations. Note that file SPRUCE_4_cohort_Rd_data_20151119.csv was replaced on November 19, 2015.
-
SPRUCE S1 Bog Vegetation Survey and Peat Depth Data: 2009
This data set reports the results of a field survey of the S1 Bog to characterize the vegetation and to determine peat depth. The survey was conducted on September 21 and 22, 2009. The initial survey of vegetation and peat depth characteristics of the target bog was conducted to evaluate the logical locations for installing replicated experimental blocks for SPRUCE. The goal was to identify multiple locations of uniform aboveground vegetation and belowground peat depth for positioning experimental units within the bog.
-
SPRUCE S1 Bog Vegetation Allometric and Biomass Data: 2010-2011
This data set reports the results of measurements on sampled aboveground tissues of trees (Picea mariana and Larix laricina), shrubs (Ledum, Chamaedaphne, and Vaccinium), and ground layer vegetation (all species) of the S1 Bog located in areas adjacent to planned experimental study plots. Ground layer vegetation was sampled from both hummocks and hollows, within a 0.25 m2 plot, to evaluate total standing biomass of bog vegetation at or near the peak of annual production. Vegetation was harvested, processed, and measured in July of 2010 and again in June of 2011.
-
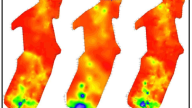
SPRUCE S1 Bog Peat Depth Determined by Push Probe and GPR: 2009-2010
This data set reports the thickness of peat for the S1 Bog measured directly with manual push probes on September 21 and 22, 2009, and measured by ground penetrating radar (GPR) across transects from January 26 to February 2, 2010 and June 2 to June 9, 2010. Also included are interpolated values of peat depth from both probe and GPR data for the S1 Bog at 1 meter square horizontal resolution.
-
Access SPRUCE Microbial Community Metagenome, Lin et al., 2014
Microbial Metabolic Potential for Carbon Degradation and Nutrient (Nitrogen and Phosphorus) Acquisition in an Ombrotrophic Peatland
Xueju Lin, Malak M. Tfaily, Stefan J. Green, J. Megan Steinweg, Patrick Chanton, Aopeau Imvittaya, Jeffrey P. Chanton, William Cooper, Christopher Schadt and Joel E. Kostka
Appl. Environ. Microbiol. 2014, 80(11):3531. DOI: 10.1128/AEM.00206-14.
Metagenomic analyses revealed that genes encoding laccases and dioxygenases, involved in aromatic compound degradation, declined in relative abundance with depth, while the relative abundance of genes encoding metabolism of amino sugars and all four saccharide groups increased with depth in parallel with a 50% reduction in carbohydrate content.